
Nobody announces the day their recognition program stopped working.
The budget still moves. The awards still flow. The platform is technically active. But somewhere between the launch celebration and the third annual Employee Appreciation Week, the program quietly shifts from "culture investment" to "expensive tradition that nobody can audit at a board meeting."
The reckoning is always a question. Usually from the CHRO. Usually in a leadership review. Almost always some version of: "What percentage of our employees actually gave recognition last quarter?"
What follows is a very particular kind of silence.
Not because HR does not care. Because the program was never built with the data infrastructure to answer that. Employee recognition programs without KPIs do not fail dramatically. They fade into a line item that survives on goodwill until the next budget cycle that needs trimming.
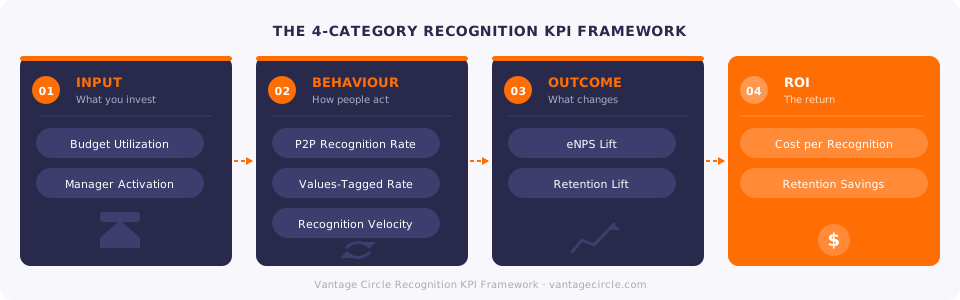
Recognition program KPIs are the metrics HR leaders use to measure whether a recognition program is changing behaviour and driving business outcomes. The 8 most-measured KPIs sit across 4 categories: input (budget, reach), behaviour (frequency, giver coverage, receiver coverage), outcome (engagement, retention), and ROI (cost per recognition, retention savings).
This guide covers 11 recognition program KPIs, organised into a named framework called the North Star Metrics, with a formula on every metric. It is the companion to our guide on how to measure employee recognition: where that post covers methodology, this one hands you the specific numbers.
The North Star Metrics: A 3-KPI Framework for Recognition Programs
A recognition program needs three North Star Metrics — Receiver Coverage, Giver Coverage, and Recognition Frequency — that together answer whether the program is reaching, activating, and sustaining recognition culture.
According to Gallup's 2025 State of the Global Workplace report, 77% of employees are not fully engaged. Recognition is one of the few variables HR can move without a headcount change or a benefits overhaul. But moving it requires knowing whether the program is actually reaching the right people. That is what the three North Star Metrics answer.
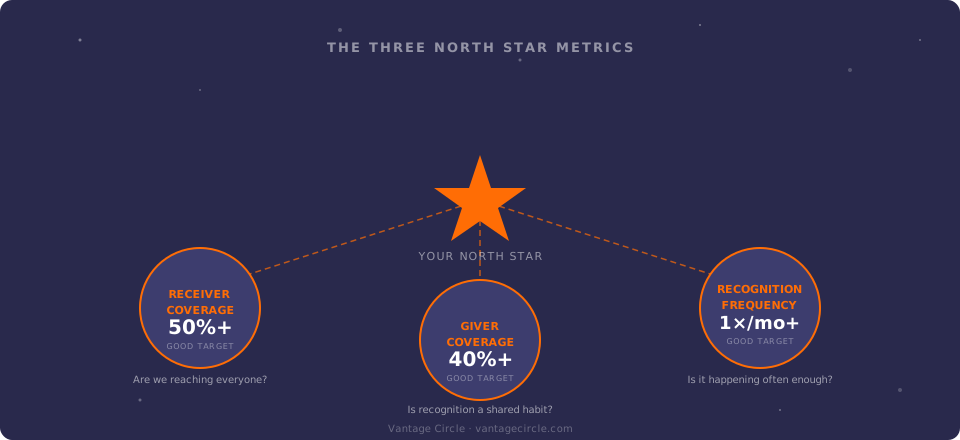
Can you tell your board what percentage of employees gave recognition last quarter? If not, the program does not have KPIs. The North Star Metrics in the next section give you that answer in a single dashboard view.
| North Star Metric | Formula | Why It Matters |
|---|---|---|
| Receiver Coverage | (Unique employees who received recognition in period ÷ Total eligible employees) × 100 | Reveals whether recognition is equitable or concentrated in visible teams |
| Giver Coverage | (Unique employees who gave recognition in period ÷ Total eligible employees) × 100 | Separates culture-driven programs from manager-only programs |
| Recognition Frequency | Total recognition events ÷ Total eligible employees ÷ Time period | Signals whether recognition is a habit or a one-off event |
Wipro recognises 57% of its 230,000 employees each fiscal year, with one recognition event every 1.2 minutes. LTTS reaches 93% participation across its workforce. Tata Communications grew peer-to-peer (P2P) recognition 185% over a five-year window, with one recognition event every two minutes.
Source: Brandon Hall Group Gold Award case studies, 2024.
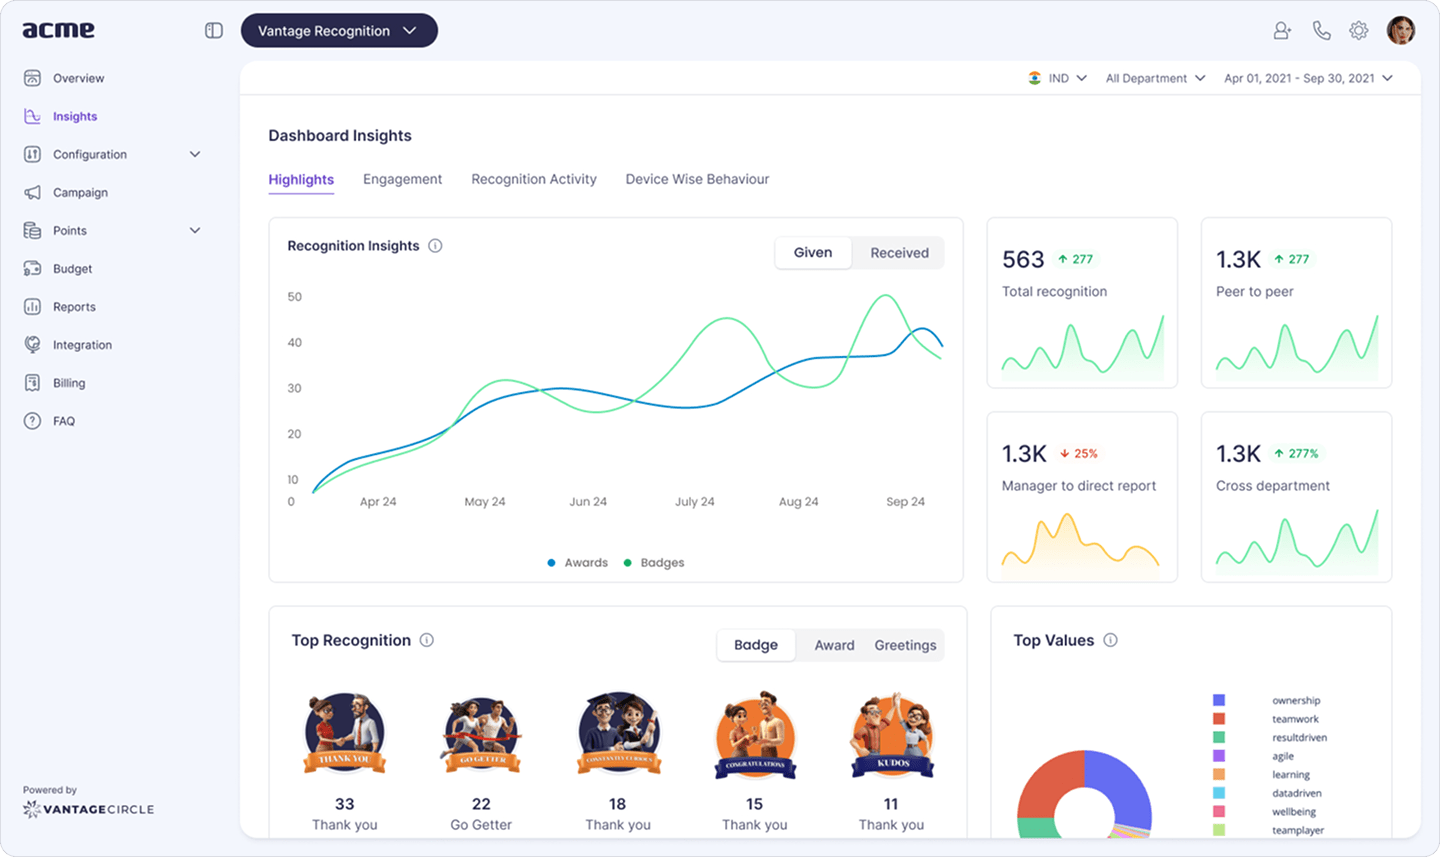
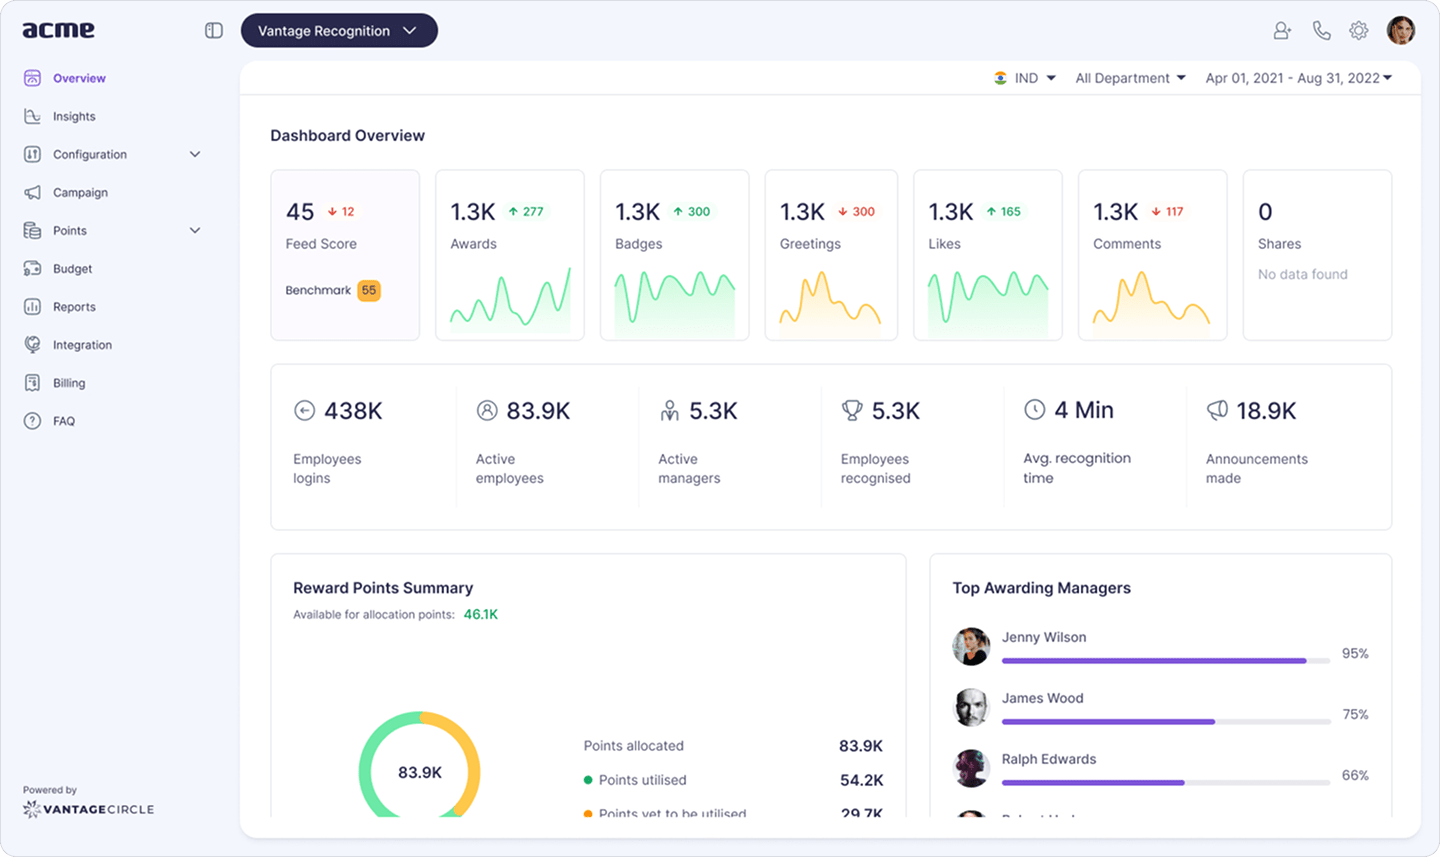
Vantage Circle's Recognition Analytics computes all three on a single screen, so HR has the numbers the CHRO wants without waiting for a quarterly data export.
8 Recognition KPIs Every HR Team Should Measure
Beyond the three North Star Metrics, eight more KPIs across four categories give HR a complete picture of recognition program health.
| KPI | Formula | Category |
|---|---|---|
| Recognition Budget Utilization Rate | (Budget spent ÷ Budget allocated) × 100 | Input |
| Manager Activation Rate | (Managers who gave recognition ÷ Total managers) × 100 | Input |
| Peer-to-Peer Recognition Rate | (P2P recognition events ÷ Total recognition events) × 100 | Behaviour |
| Values-Tagged Recognition Rate | (Recognitions linked to a core value ÷ Total recognitions) × 100 | Behaviour |
| Recognition Velocity | Average days from hire date to first recognition received | Behaviour |
| eNPS Lift | Post-recognition-launch eNPS score minus pre-launch eNPS score | Outcome |
| Retention Lift Among Recognised Employees | Retention rate (recognised cohort) − retention rate (non-recognised cohort) | Outcome |
| Cost per Recognition vs Retention Savings | (Program cost ÷ Total recognition events) vs (Cost per voluntary turnover × turnover reduction %) | ROI |
Input KPIs
1. Recognition Budget Utilization Rate
Budget Utilization Rate measures what share of the allocated recognition budget was actually spent in a given period.
Low utilisation, under 70%, usually points to one of three things: managers do not know how to use the platform, the nomination process has too many steps, or the program was never communicated beyond the launch email. When utilisation is low, check manager activation first. If activation is also low, the problem is awareness. If activation is healthy but spend is lagging, the problem is platform friction. High utilisation above 95% without matching behaviour KPI gains is worth investigating for gaming. Track this monthly in the first program year to catch adoption issues before they become habits.
2. Manager Activation Rate
Manager Activation Rate tracks the proportion of managers who actively gave at least one recognition in a given period.
This is the canary-in-the-coal-mine KPI for any top-down program. SHRM's 2025 research consistently places manager-led recognition as the highest-ranked driver of employee satisfaction with recognition programs. If manager activation sits below 50%, the program is structurally stalled regardless of how many peer recognitions are flowing.
A useful gut check: pull your recognition data and filter by sender job title. If the count drops steeply past team lead level, you have a manager activation problem hiding behind an otherwise acceptable volume number.
Behaviour KPIs
3. Peer-to-Peer Recognition Rate
Peer-to-peer recognition rate separates culture-driven programs from manager-only programs. It measures the proportion of recognition events initiated by non-managers.
Target 30% P2P by month 6 of launch, and 40% or above at program maturity. Programs where P2P sits below 25% are functionally manager-led programs with a peer-recognition feature nobody uses.
One HR team found their P2P rate at 11% after eight months of what they considered a successful program launch. What it actually meant: nearly every recognition was flowing top-down. The peer feature existed. Nobody was using it because the nomination flow had six steps and was buried in the platform. If your number is stalling, the first thing to audit is friction. Not culture. Review how peer-to-peer recognition flows are surfaced and whether a non-tech-native employee can complete a nomination in under a minute.
Vantage Rewards' P2P recognition flow surfaces participation rates by department, so HR can see which teams have built a culture and which still need a push.
4. Values-Tagged Recognition Rate
Values-Tagged Recognition Rate measures how often recognition is explicitly tied to a company core value.
This is a culture KPI most competitor frameworks do not measure. A high values-tagging rate signals that employees understand what behaviour the organisation is trying to reinforce. A low rate means recognition is happening but values alignment is not. Target above 60% by month six of any structured program.
Most HR teams discover this number for the first time and it is lower than they expected. Sometimes in single digits on programs that have been running for a year. That gap between recognition happening and values being consciously reinforced is exactly where culture drift begins.
5. Recognition Velocity (Time-to-First-Recognition for New Hires)
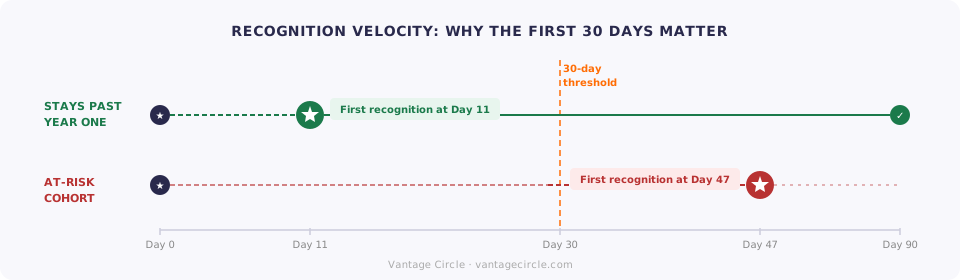
Recognition Velocity measures the average number of days between a new hire's start date and the first recognition they receive.
Almost no recognition framework tracks this, yet it sits inside a window that McKinsey's 2024 talent research identifies as the highest-leverage period for retention: the first 90 days. A new hire who goes 45 days without a single acknowledgement from a peer or manager has already started forming an opinion about whether they belong. A recognition velocity above 30 days is a retention risk hiding in plain sight inside your onboarding process.
Run the number for your last two hiring cohorts. If the average crosses 30 days, something in your onboarding handoff is broken. Either managers are not being prompted at the right moment, or the recognition platform is not accessible in the tools new hires are actually using in week one.
Outcome KPIs
6. eNPS Lift
eNPS Lift measures the change in employee Net Promoter Score (eNPS) attributable to recognition program activity.
Run a baseline pulse before launch, then re-run at the 90-day and 180-day marks. If your pre-launch eNPS was 24 and your 90-day reading comes back at 32 with receiver coverage at 60%, that eight-point move is attributable and presentable. If coverage is still at 18% and eNPS is flat, the data is telling you something just as useful: the program has not reached enough people to move anything yet.
Vantage Pulse runs eNPS alongside custom recognition driver questions and surfaces sentiment shifts on the same timeline as recognition activity, so the story builds itself.
7. Retention Lift Among Recognised Employees
Retention lift among recognised employees is the outcome KPI that translates recognition directly into a financial argument.
The AIRe Report benchmark: organisations with recognition-driven cultures see 92% retention versus 76% in organisations without structured programs. If you are not tracking recognised versus non-recognised cohorts separately, you cannot make that argument with your own data. Pair this with the employee engagement KPIs you are already tracking to build a fuller retention story. See also our guide on employee retention strategies for additional levers HR can pull in parallel.
ROI KPIs
8. Cost per Recognition vs Retention Savings
Cost per recognition event, compared against retention savings from lower voluntary turnover, is the ROI calculation that closes every budget conversation.
This is the KPI competitors rarely commit to because it requires pairing recognition spend data with HR finance data. But the arithmetic is straightforward. If your cost per voluntary turnover is $15,000 and your recognised-versus-non-recognised retention gap is 12 points across 100 employees, the program is saving $180,000 per year. Put that number on a slide and the budget conversation becomes much shorter.
Vantage Circle's Recognition Analytics computes receiver coverage, giver coverage, sentiment correlation, equity gaps, and ROI on a single dashboard built for CHRO-level reporting. No spreadsheet pulls, no manual extraction.
Explore Recognition Analytics →
Modern KPIs Most Programs Miss
Three modern recognition KPIs distinguish data-mature programs from compliance-minimum programs and are almost universally absent from competitor frameworks: Recognition Equity, Sentiment-Recognition Correlation, and Recognition Velocity for existing employees.
Recognition Equity (Distribution by Demographic, Department, and Level)
Recognition Equity measures whether recognition is distributed proportionally across all employee cohorts or concentrated in specific teams, levels, or demographics.
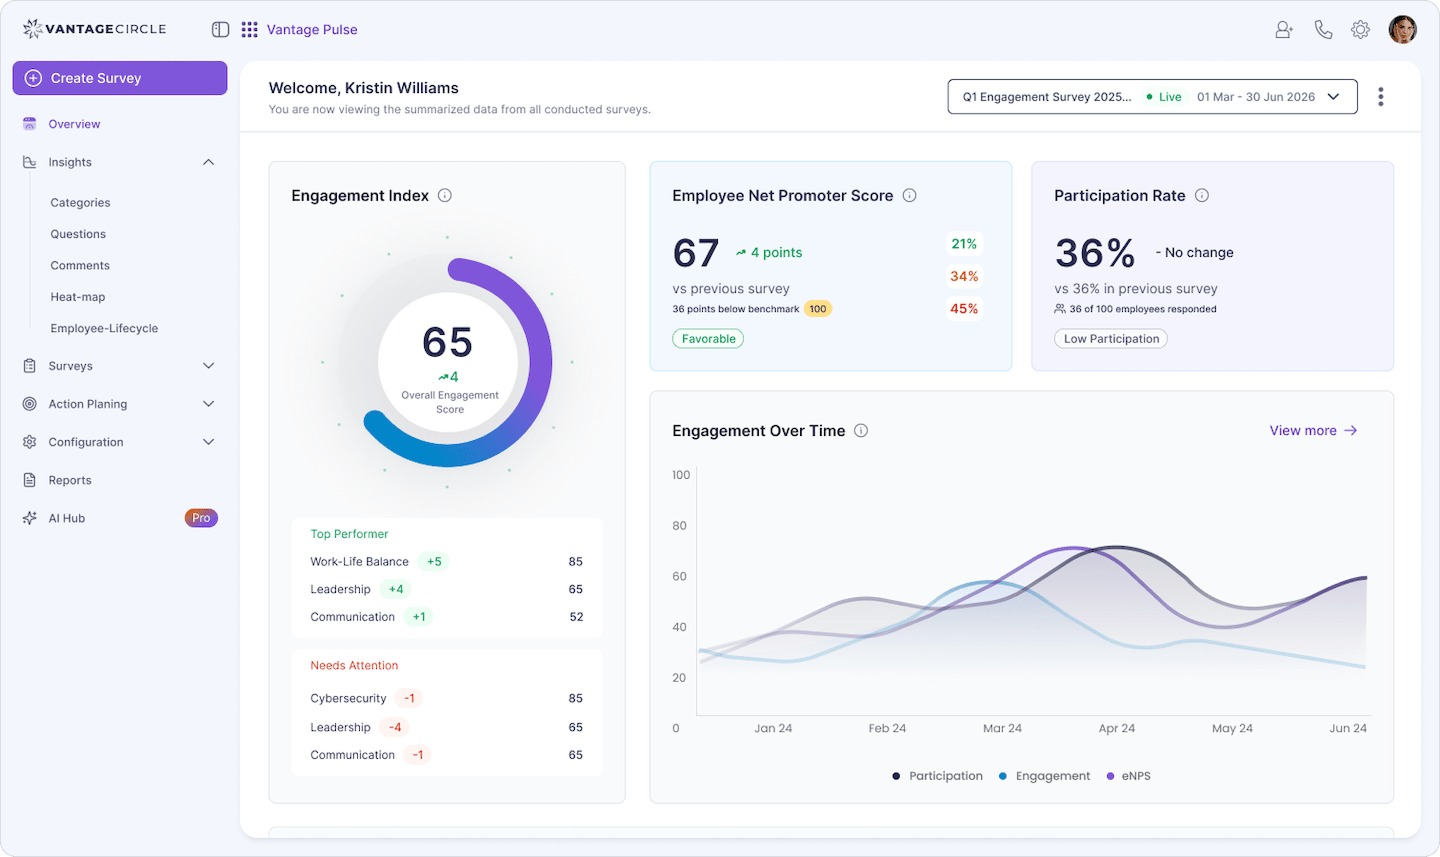
A program where the top 20% of departments account for 70% of recognition events has an equity problem. It is also a potential legal and cultural risk if the under-recognised cohorts correlate with protected characteristics. Vantage Circle's department-wise insights surface which teams are over- and under-recognised, making the equity gap measurable before it becomes a retention or compliance issue.
Sentiment-Recognition Correlation
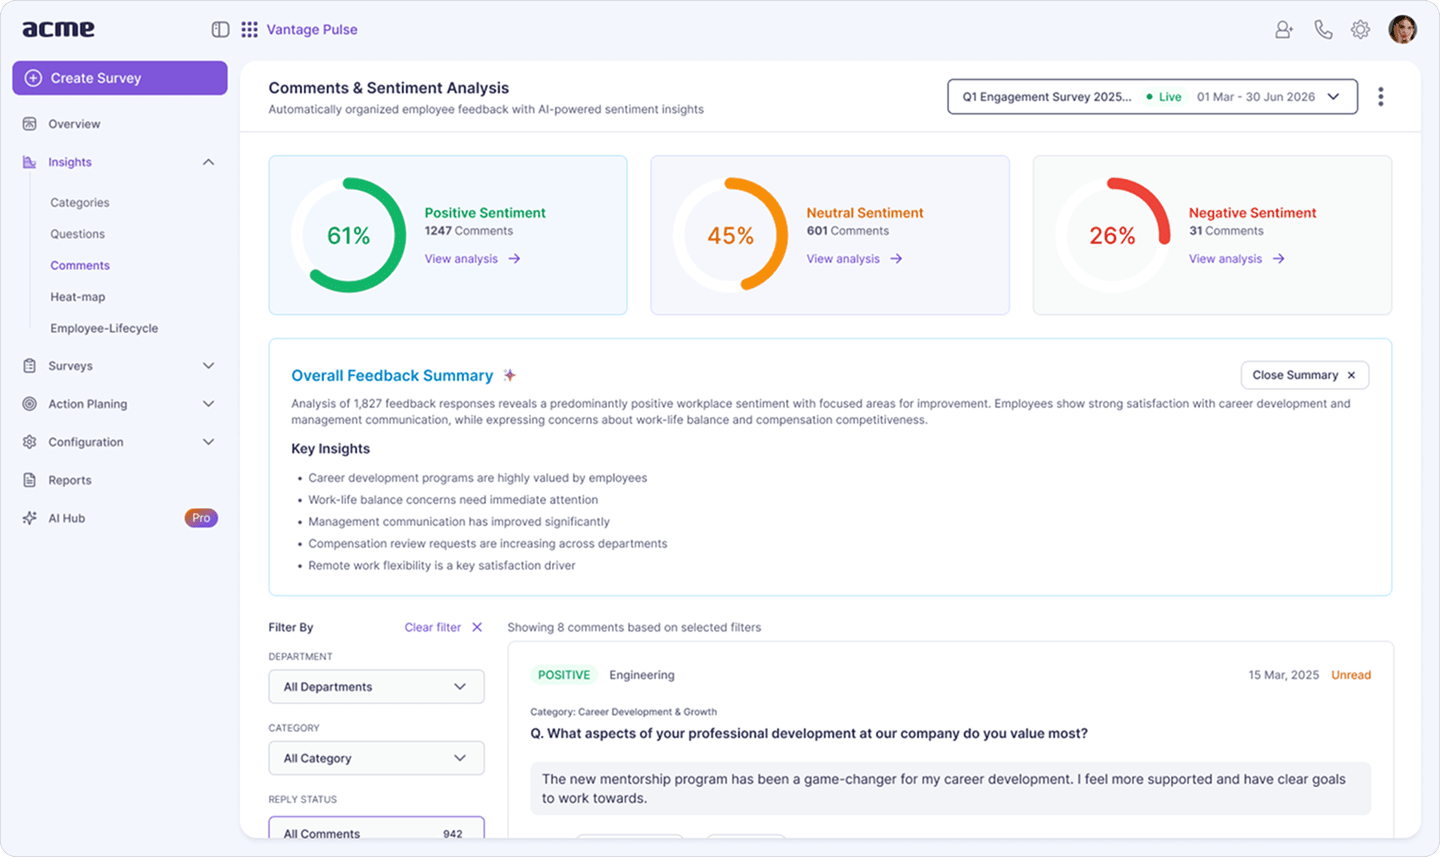
Sentiment-Recognition Correlation measures whether recognition activity shifts how employees describe their experience in open-text pulse responses.
This is the hardest KPI to compute manually and the most compelling one in a board conversation. It answers the question board members actually ask: "Is the program making people feel better, or is it just moving award spend?" Vantage Pulse's sentiment analysis, combined with Recognition Analytics event data, surfaces this correlation automatically. No manual extraction or data-merging required.
Recognition Velocity (Silent Employee Detection)
For existing employees, Recognition Velocity measures the percentage of your workforce with zero recognition activity in a rolling 60-day window.
Most programs track velocity only for new hires (see KPI #5 above). That is the right starting point. The next level is applying the same lens to the whole workforce. An employee who gave recognition regularly and then stops is showing a disengagement signal weeks before it appears in a pulse survey. An employee who consistently appears in the "never recognised" cohort month after month is invisible to your program regardless of how healthy your aggregate coverage looks.
The fix is not a campaign. It is a manager alert: flag every direct report who has gone 60 days without a recognition event and prompt the manager. The cadence catches drift before it becomes attrition.
Which KPIs to Track at Each Program Stage
Different KPIs matter at different program stages: launch programs need reach and activation metrics, while mature programs need equity and ROI.
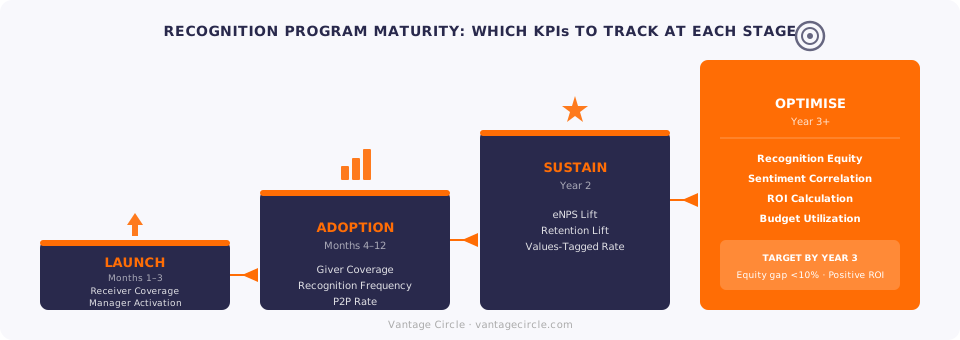
One of the most common measurement mistakes is applying year-three metrics to a month-one program. A launch program with 15% receiver coverage is not failing. It is in the ramp phase. Judging it against a retention lift benchmark is like judging a seed by whether it has produced fruit.
| Stage | Primary KPIs | What "Good" Looks Like |
|---|---|---|
| Months 1 to 3 (Launch) | Receiver Coverage, Manager Activation Rate | 25%+ coverage by week 4; 60%+ manager activation |
| Months 4 to 12 (Adoption) | Giver Coverage, Recognition Frequency, P2P Rate | 50%+ giver coverage by month 6; P2P rate above 30% |
| Year 2 (Sustain) | eNPS Lift, Retention Lift, Values-Tagged Rate | Engagement +5 pts vs baseline; 60%+ values-tagging |
| Year 3 and Beyond (Optimise) | Equity, Sentiment Correlation, ROI | Equity gap under 10% across cohorts; positive ROI |
LTTS' ROAR program reached 93% participation within two years of launch. By the end of year two, 83% of active users had received recognition. That is a by-stage KPI story: coverage built in year one, depth built in year two.
Source: LTTS case study, Brandon Hall Group Gold Award, 2024.
How Vantage Circle Reports Recognition KPIs
Vantage Circle's Recognition Analytics and Pulse Analytics compute the 11 KPIs in this guide automatically, with dashboards built around the North Star Metrics framework.
Three things the platform does that manual reporting cannot:
Real-time coverage by department. Recognition Analytics surfaces receiver coverage and giver coverage at the team level without a spreadsheet pull. The view updates as recognitions happen, not once a quarter when someone finally exports the data.
Automatic sentiment correlation. Vantage Pulse ties open-text sentiment scores to recognition event timelines, so HR can see the cause-and-effect story rather than just describing it. The correlation that typically takes an analyst a week to build runs automatically.
Equity visibility before it becomes a problem. The department-wise insights view flags under-recognised cohorts as they emerge, giving HR a data point to act on rather than a retrospective to explain.
Five Common Mistakes in Recognition Program KPIs
Five mistakes consistently derail recognition KPI programs: tracking volume without coverage, ignoring giver-side metrics, comparing programs at different maturity stages, fabricating ROI, and skipping the equity audit.
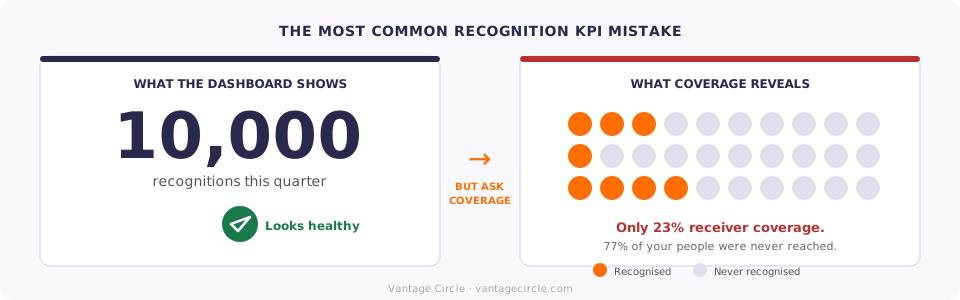
Tracking volume and calling it coverage. Total recognitions given is an activity metric. A program can issue 10,000 awards and still leave 60% of employees untouched, because volume concentrates in the same visible teams every quarter. Receiver Coverage and Giver Coverage are the metrics that expose this. Volume hides it.
Measuring only who received, never who gave. A program where 80% of recognitions come from 15% of managers is not a recognition culture. It is a manager task with a recognition label. Giver Coverage is the metric that reveals this split. Without it, HR has no line of sight into whether recognition is becoming habitual or staying compliance-driven.
Comparing programs at different maturity stages. A six-month-old program with 35% receiver coverage is outperforming most launch benchmarks. Comparing it to a three-year program's 80% is a false equivalence that kills internal advocacy. Fix it by using the stage-based benchmarks in the table above rather than competitor case studies. A month-six program should be benchmarked against other month-six programs, not year-three ones.
Fabricating ROI. Using industry retention cost averages without your own voluntary turnover data produces numbers that fall apart under board scrutiny. The fix is straightforward: pull your actual voluntary turnover rate, multiply by your real cost-per-hire, and use that as the baseline for your retention savings calculation. A smaller number built on your own HR finance data survives cross-examination. An inflated number built on SHRM averages does not.
Skipping the equity audit. Recognition equity is not a nice-to-have KPI. Programs where recognition is concentrated in certain teams, levels, or demographics risk reinforcing the very biases they were designed to counter. Run the department-wise coverage report quarterly and flag any cohort sitting more than 15 points below the company average.
FAQ
How to measure success of recognition programs?
Start with three numbers: what percentage of employees received recognition, what percentage gave it, and how often. Then add one outcome KPI: the eNPS change between your pre-launch baseline and your 90-day reading. If coverage is above 50% and eNPS has moved at least five points, the program is working. If coverage is high but eNPS is flat, the recognition is reaching people but not resonating. Those are different problems with different fixes.
What are the 5 main KPIs for a recognition program?
Receiver Coverage, Giver Coverage, Recognition Frequency, Peer-to-Peer Recognition Rate, and eNPS Lift. In that order. The first three tell you whether the program is alive. The fourth tells you whether culture is carrying it or management is. The fifth tells you whether any of it is changing how people feel about work.
What are the 4 P's of KPI in a recognition program?
People (who is giving and receiving), Participation (what percentage of the eligible workforce is active), Performance (whether recognition is tied to actual values and behaviours, not just tenure), and Payback (the ROI calculation connecting program spend to retention savings). Most recognition programs live entirely in the first two P's and never reach the third or fourth.
What are the 4 pillars of KPI in a recognition context?
Input (are we spending the budget and activating managers?), Behaviour (are employees actually using the program and in what pattern?), Outcome (is recognition shifting engagement and retention?), and ROI (does the math work?). A recognition dashboard that only reports input and behaviour has half the picture. The programs that get cut are the ones that never built the outcome and ROI layer.
What are the 7 performance metrics for employee recognition?
The seven that matter most in sequence: Receiver Coverage, Giver Coverage, Recognition Frequency, Manager Activation Rate, Peer-to-Peer Recognition Rate, eNPS Lift, and Retention Rate Among Recognised Employees. The first three are for launch health, the next two for behaviour depth, and the last two for outcome proof. This guide adds four more for programs at maturity: Budget Utilisation, Values-Tagged Rate, Recognition Velocity, and Cost per Recognition versus Retention Savings.
What is a common mistake in employee recognition programs?
Trusting the volume number. A program with 10,000 recognitions in a quarter looks healthy until you ask how many unique employees sent those recognitions and how many received one. Usually the answer reveals that a small group of enthusiastic managers is carrying the whole count, and a large portion of the workforce has never been touched by the program at all.
From Anecdote to Audit-Ready: The KPI Shift That Changes the Board Conversation
The difference between a defended program and an anecdote-driven one is data structure.
An anecdote-driven program says, "We had 12,000 recognition events last quarter." An audit-ready program says, "57% of our workforce received recognition, manager activation reached 74%, P2P rate grew from 22% to 41%, and eNPS moved eight points since launch."
The second version answers the CHRO's question before they ask it.
Start with the three North Star Metrics. They are the numbers that tell the board whether the program is running or just breathing. Add the eight-KPI spine as the program matures. Layer in Equity and Sentiment Correlation when you are ready to close the gaps most programs never even see.
See All 11 Recognition KPIs on One Dashboard
Vantage Circle's Recognition Analytics computes receiver coverage, giver coverage, equity gaps, sentiment correlation, and ROI automatically. No spreadsheet pulls, no manual extraction.
Built for HR directors and CHROs who present to leadership.
Explore Recognition Analytics →
Lupamudra is a content marketing specialist at Vantage Circle, where she has written 50+ articles on employee recognition, rewards, and workplace culture, alongside employee engagement, diversity and inclusion, and HR compliance topics, including how India's tax rules apply to recognition and rewards programs.
Connect with Lupamudra on LinkedIn.