
Every employee recognition program eventually gets the same question from a leadership sponsor: "What target are we trying to hit?"
Most teams answer it the wrong way. They pull an industry average from a research report, present it in the launch deck, and commit to a number that has nothing to do with where their organization is actually starting from. Six months later, the program is either blowing past a target that was too low to mean anything, or quietly missing one that was never realistic to begin with.
A recognition program benchmark is the goal your program is tracked against, and setting the right one is harder than it looks. Getting that number right depends on three things most articles skip: your company size, your program maturity, and the baseline you actually started from. Industry averages are a poor substitute for any of them.
This guide works through a 5-step process for setting benchmarks you can defend in a sponsor meeting. It covers the metrics that actually matter, benchmark ranges segmented by company size and maturity, and an ROI calculation you can put in front of finance without flinching. The five metrics sitting underneath all of it: participation rate, recognition reach, recognition frequency, eNPS shift, and voluntary turnover delta.
What a Recognition Program Benchmark Actually Is
A recognition program benchmark is a target range for a specific metric, set against your own historical baseline and adjusted for program maturity. Not the same thing as a key performance indicator (KPI). That distinction matters more than most programs realize.
A KPI tells you whether the program is moving the needle on something the business cares about: retention, engagement score, eNPS. A benchmark tells you whether the program's activity level is healthy enough to move that needle at all. Participation rate is a benchmark. The eNPS shift it eventually predicts is a KPI. Confusing the two is how programs get strapped to unfair targets and lose sponsorship in year 2.
Here is what most leaders miss. "Industry average" is almost useless as a standalone benchmark. An average folds a 50-person technology startup in with a 20,000-person manufacturing company and calls it a number. Your Year 1 participation target for a manufacturing workforce that has never had a formal recognition program looks nothing like the mature-state benchmark for a tech company four years in. The segmented benchmark tables later in this article exist precisely because of that gap.
There is a reason this gap matters. The Recognition Effect, a Vantage Circle × Great Place to Work India study covering 5.7 million employees across 2,000 organizations, found that only 55% of employees feel truly recognized (The Recognition Effect, 2025). Half the workforce is sitting in a recognition blind spot while most programs report aggregate participation numbers that look respectable. Benchmarking is what makes that gap visible.
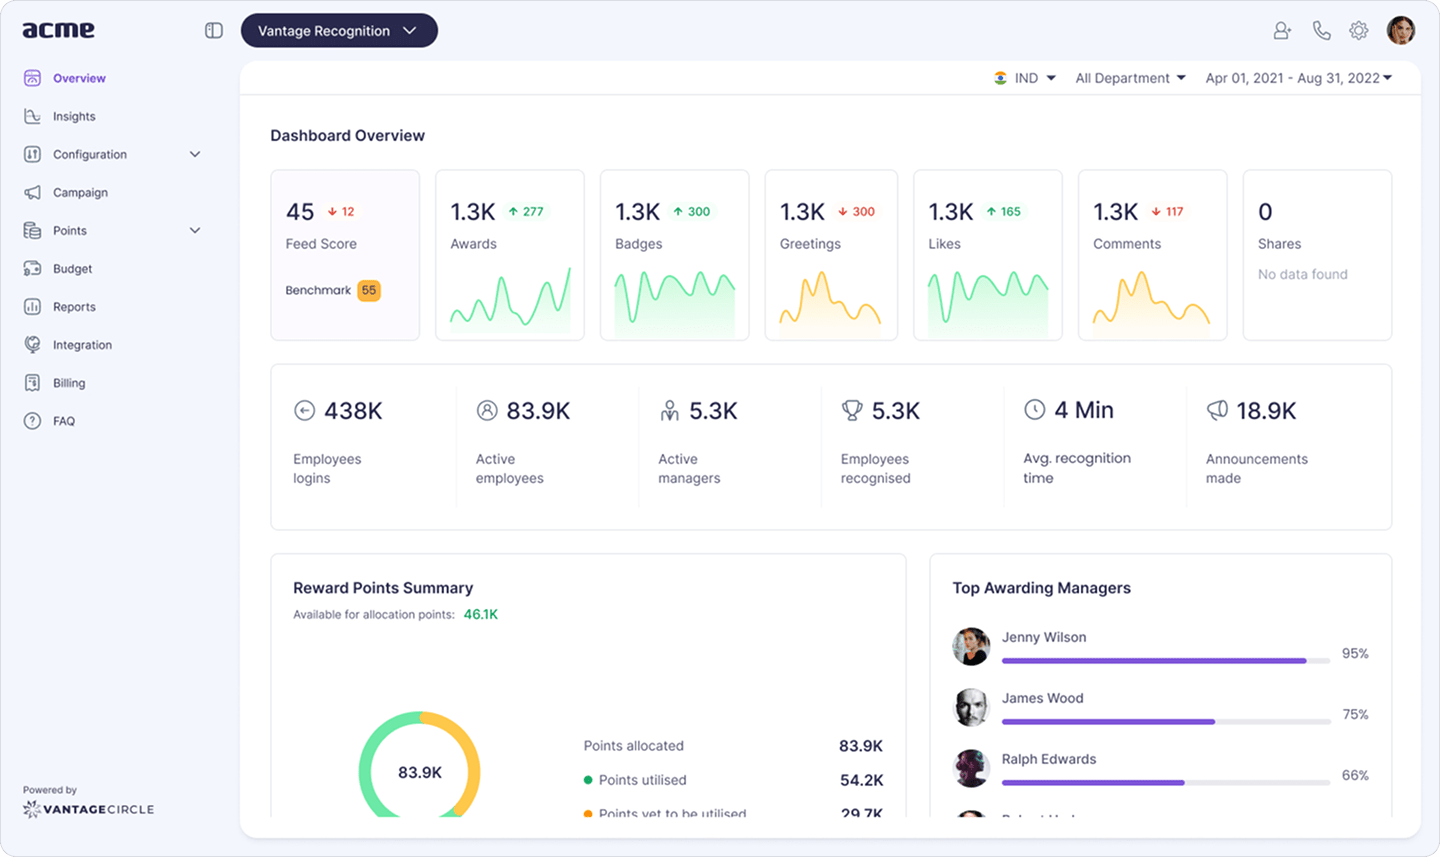 Source: Vantage Recognition and Rewards Platform
The 5-Step Framework for Setting Realistic Recognition Program Benchmarks
Most programs skip straight to numbers. They pick a participation target from a competitor's case study, announce it in the launch deck, and wonder 8 months later why the number is not moving. The framework below is designed to prevent that. Five steps, in order. Do not skip step 1.
Step 1: Define What the Program Is Supposed to Do
Benchmarks are downstream of goals. Full stop.
If you cannot state what the recognition program is solving for, any benchmark you set is arbitrary. Programs generally fall into one of four goal buckets: improving engagement scores in a specific cohort, reducing voluntary turnover in high-risk roles, making company values visible through everyday behavior, or surfacing recognition activity that was previously happening informally but invisibly. Each one pulls you toward a different leading metric. A values-reinforcement program lives in recognition frequency tied to specific value tags. A retention program lives or dies by the voluntary turnover delta among recognized versus non-recognized employees. Pick one primary goal. The secondary goals can inform the dashboard later.
There is a clean data point that should settle the goal debate. Vantage Circle's Annual Rewards and Recognition Report 2024-25, built with SHRM and AON, found that 67% of organizations that targeted behavioral reinforcement through their R&R programs reported high to very high effectiveness. Programs that targeted loyalty and retention alone saw less than 50% report the same. The lesson: pick a goal that names a behavior, not an outcome. Outcomes follow.

VANTAGE INFLUENCERS PODCAST
"When I talk about culture in organizations, I talk about it as the outcome of what happens based on systems, beliefs, attitudes, programs, policies. Culture really — it's not something you can just create on an Excel spreadsheet and have it magically happen. Humans are unpredictable."
— Adam Massman, Chief People Officer at Netchex
Listen to the EpisodeStep 2: Pull a Baseline Before You Commit to a Target
Committing to a number before you know where you are starting from is the most common benchmark mistake, and it is completely avoidable.
A 60% participation rate looks meaningful until you learn that informal recognition in the organization is already running at 55%. And a 30% target for a team that has never received a single structured recognition in two years is not conservative. It is a stretch goal dressed up as modesty.
The 30-day baseline rule works like this: run the program for a full month before announcing any targets. Let participation happen without a number hanging over it. Then pull the data: what was the participation rate, what was the reach, how often were people actually recognizing each other. That is your real floor. Your year 1 target is a lift from that number, not a lift from whatever benchmark someone found in a SHRM report.
I have watched programs launch with a "70% participation within 90 days" headline target that leadership loved in the slide deck and that the HR team quietly abandoned by month 4. Nobody had pulled the data to know whether 70% was achievable, wildly ambitious, or effectively already reached. The baseline is not bureaucracy. It is self-defense.
Vantage Circle's Recognition Analytics dashboard makes the baseline pull a one-tab exercise rather than a manual HRIS extraction. That matters when you are trying to get a credible number into a sponsor conversation fast.
Step 3: Segment by Team, Tenure, and Location
An organization-wide participation rate of 45% sounds acceptable. Then you find out that 3 departments are at 80% and 2 departments are at 10%.
The aggregate number hides both the teams that do not need help and the teams quietly dragging the program's impact metrics down. Before setting targets, cut the baseline by department, then by manager level, then by tenure band. Location matters too if you have distributed or shift-based teams. Once you have that picture, set benchmarks at the cohort level. A 6-month employee who has not yet received a single recognition is a completely different problem from a 5-year employee who gets recognized regularly. That under-recognition pattern is the same dynamic explained in our breakdown of the recognition gap. Vantage Pulse's department-wise insights surface those gaps before the first executive summary has to carry a false average.
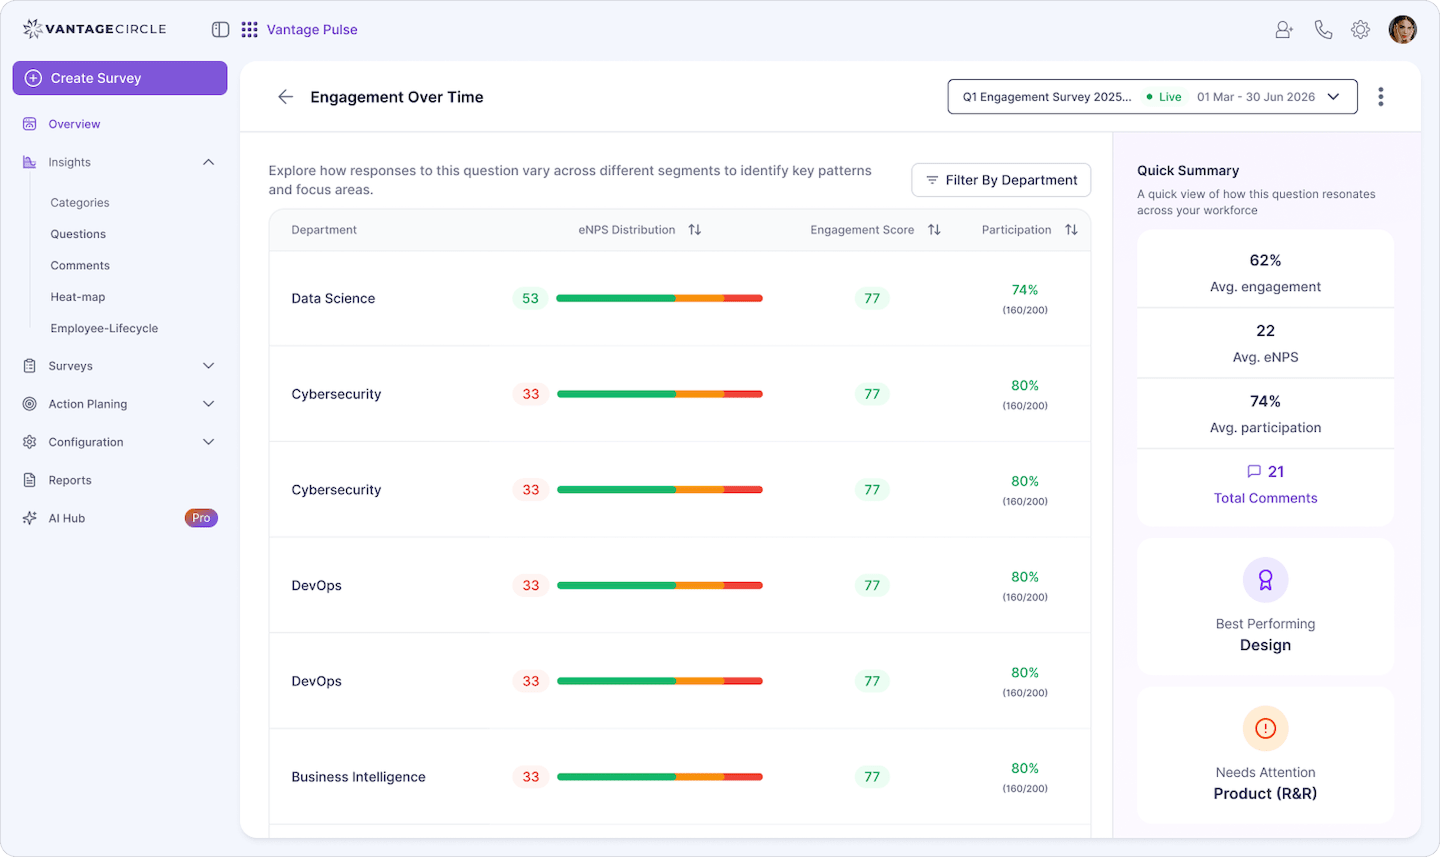 Source: Vantage Pulse
The AIRe 2024-25 report flags one specific segmentation gap worth naming. Recognition coverage runs above 90% across mid and junior levels in most organizations, but only ~80% of companies cover senior employees with any formal R&R element (AIRe Report 2024-25). Senior layer under-coverage is the most common reason aggregate participation numbers look healthy while sponsor sentiment quietly turns. Segment for it explicitly.
Step 4: Set a Year-1 Range, Not a Year-3 Number
The over-promise trap kills more recognition programs than budget cuts do.
Vantage Circle's AIRe Report 2024-25 gives the reality anchor: across 250 surveyed companies, only 6% recognize more than 60% of employees in a year. Only 19% clear 40% reach. The median band sits at 10 to 20% reach. The mature ceiling, in other words, is the 60%+ reach band that just 1 in 16 surveyed programs occupies. That is what an aspirational year-3-or-beyond target looks like in VC's data. It is also completely wrong as a Year 1 target.
Year 1 programs are building behavior from scratch. Managers need training, and manager participation in the recognition program is the single biggest predictor of year-1 traction. Employees need time to trust that this is not another HR initiative that will quietly disappear. The social scaffolding that makes recognition feel normal takes 6 to 12 months to solidify. A Year 1 reach target in the 10 to 20% band (the AIRe median) is not low expectations. It is an honest accounting of where programs actually land. Stretch to 20 to 40% if you have strong manager commitment from day one.
Set phased benchmarks: year 1 in the median band, years 2 to 3 climbing into the 20 to 40% reach quartile, and mature state in the 40%+ top quintile. Show the trajectory. A sponsor who sees a 3-year arc against the AIRe distribution is far more patient about the year 1 number than a sponsor who was told 70% from day one and is watching the program fall short of it in month 8.

VANTAGE INFLUENCERS PODCAST
"Think about this as being a long-term game that you're working towards. This is about building for the future. This isn't a quick fix, and you need to recognize you may not always get it right — and be ready to pivot and get back on track."
— Mark Edgar, People-First Culture Leader
Listen to the EpisodeStep 5: Set the Review Cadence and the Recovery Rule
A benchmark with no review schedule is decoration.
Set a quarterly review. Pull the metrics, compare them against the phased benchmark, and write down what moved and what did not. The act of writing it down matters: programs that review verbally in a meeting and move on have no accountability trail when a sponsor asks what happened between Q1 and Q3.
The recovery rule is straightforward. If two consecutive quarterly reviews show a metric trending down rather than up, the program needs an active intervention, not continued monitoring. Define that rule before the program launches. Written down. So the recovery decision is a protocol, not a political conversation that no one wants to start.
The AIRe report adds a quieter finding here that is worth bolting into the cadence. Companies that do a detailed ROI evaluation see a 2-3X higher impact across key recognition objectives than those that do not. The quarterly review is where ROI math gets re-pulled, not just a metric scoreboard.
The 5 Recognition Program Metrics That Matter
There is a split in these 5 metrics that most programs ignore. Three of them are leading indicators: participation rate, recognition reach, and recognition frequency. They move first, in the early months of the program, and they tell you whether the behaviors are forming before you have any outcome data. The other two, eNPS shift and voluntary turnover delta, are lagging. They confirm later whether those behaviors actually changed anything. Most programs only report the lagging ones and then wonder why they cannot demonstrate impact until 18 months in.
| Metric | Leading or Lagging | What It Tells You | How to Calculate |
|---|---|---|---|
| Participation rate | Leading | Share of employees who gave at least 1 recognition in the period | (Employees who gave recognition / Total employees) x 100 |
| Recognition reach | Leading | Share of employees who received at least 1 recognition in the period | (Employees who received recognition / Total employees) x 100 |
| Recognition frequency | Leading / Bridge | Average recognitions per active user per month | Total recognitions / Active givers in the period |
| eNPS shift | Lagging | Net sentiment change vs. pre-launch baseline | Post-launch eNPS score minus pre-launch eNPS score |
| Voluntary turnover delta | Lagging | Turnover rate difference between recognized and non-recognized cohorts | Turnover rate (non-recognized) minus turnover rate (recognized) |
1. Participation Rate
Participation rate is the first number every leadership sponsor asks about, and the one most programs misreport.
The correct denominator is total eligible employees. Not active users. A program with 500 employees and 200 giving at least one recognition in a quarter has a 40% participation rate. Not 80%, even if 80% of the people who actually logged in gave a recognition. That distinction looks minor. In a sponsor report it is not.
Vantage Circle's Recognition Analytics dashboard surfaces participation rate directly, with the right denominator already in place. Manual HRIS exports introduce enough lag and rounding error that the number arrives in the meeting already slightly wrong.
2. Recognition Reach
Reach is the more honest metric. A program where 60% of employees give recognition but 85% receive it is healthier than one where both numbers sit at 40%, even though the participation rate looks better on the first program.
What reach measures is whether recognition is spreading through the organization or concentrating in a small cohort. The recognition-reach benchmark is harder to find in published research, which is one reason it routinely gets dropped from reporting. That is a mistake. High participation alongside low reach is almost always the signature of a manager-centric program that has never activated peer-to-peer recognition. Vantage Rewards' peer-to-peer feature spreads the reach denominator naturally rather than leaving it to concentrate at one layer.
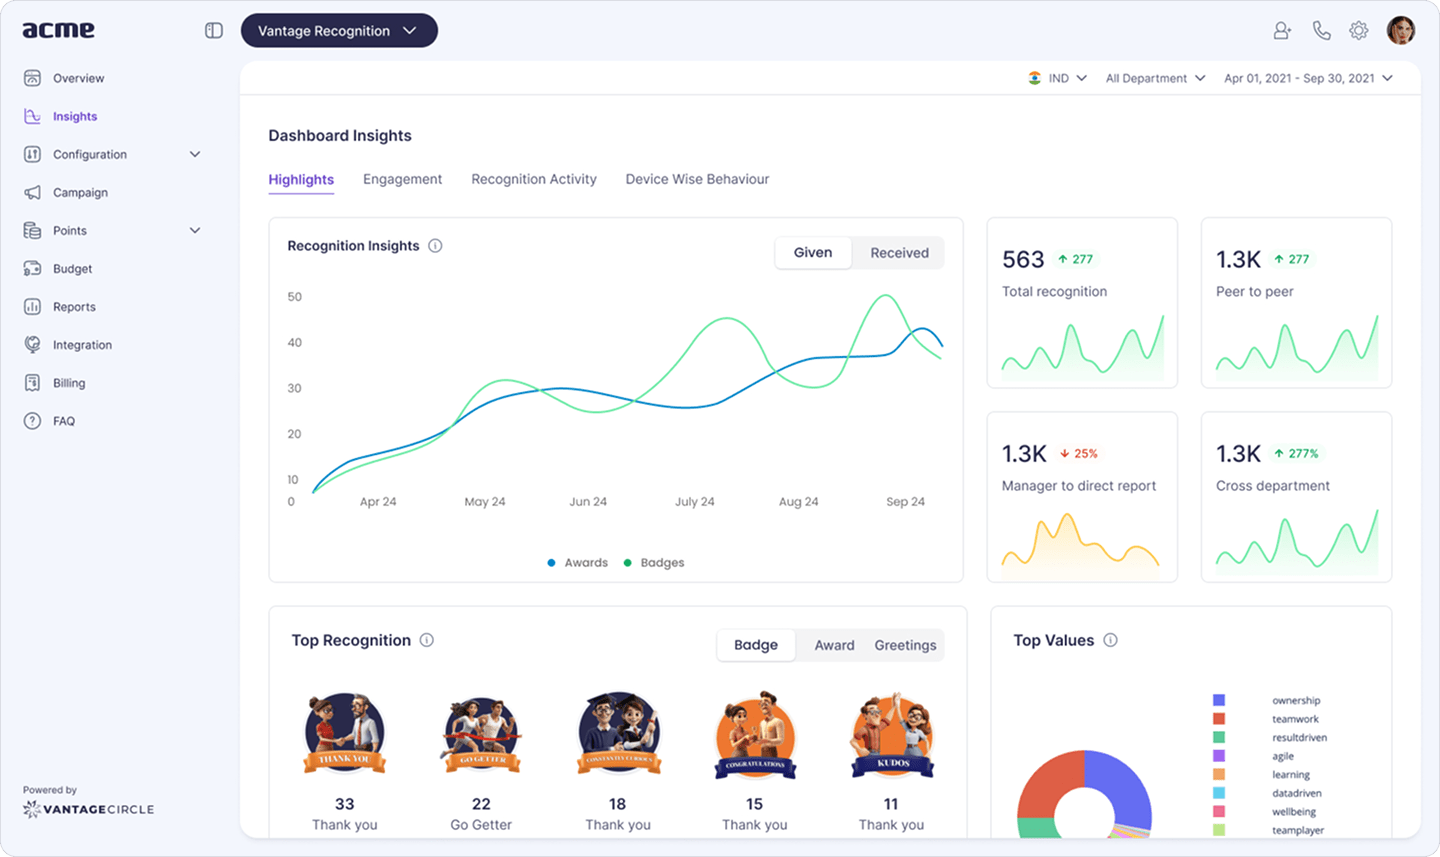 Source: Vantage Recognition and Rewards Platform
High reach is also where peer-to-peer recognition does its heavy lifting. The State of Recognition & Rewards 2025 found that Leader programs adopt peer-to-peer recognition at a +30 percentage-point gap versus median programs, and recognition reach climbs in lockstep. That kind of reach does not happen in manager-only programs.
3. Recognition Frequency
Frequency is how often active users are giving recognition, expressed as recognitions per active user per month. Low frequency from a high-participation program is a warning sign. It means employees completed one recognition, checked the box, and went quiet. Technically present. Not habitual.
A frequency of 1.5 to 2.5 recognitions per active user per month is the operational range for a program that is building real behavior. Below 1.5, recognition is event-driven. Above 4, you are usually looking at a campaign spike rather than a genuine cultural shift.
Vantage Circle's AIRe Report 2024-25 shows how the median program is structured for frequency. Of 250 surveyed companies, 36% run year-round / anytime recognition as their primary cadence, 28% run quarterly, 24% monthly, 10% annual, and 3% half-yearly. Year-round / anytime is what drives the 1.5+ per-user monthly frequency target. Quarterly-only programs almost never hit it.
The benchmark to aim for in a mature program is what Wipro's Winners' Circle program has hit: 1 recognition every 1.2 minutes across the organization in 2023, with 553,490 total awards in 2 years (Wipro Case Study). That is what frequency looks like when recognition is a habit, not a campaign.
4. eNPS Shift
The eNPS, or employee Net Promoter Score, measures how likely employees are to recommend the organization as a place to work. Measured at 90 days post-launch and compared to the pre-launch baseline, the eNPS shift is the first lagging confirmation that a recognition program changed how people feel about being there. Not just whether they collected a certificate.
Vantage Pulse handles the baseline survey and the re-measurement. The 90-day interval is not arbitrary. It is roughly the window in which recognition behavior from month 1 starts to settle into the team's operating rhythm, which is when any sentiment shift becomes detectable above the noise.
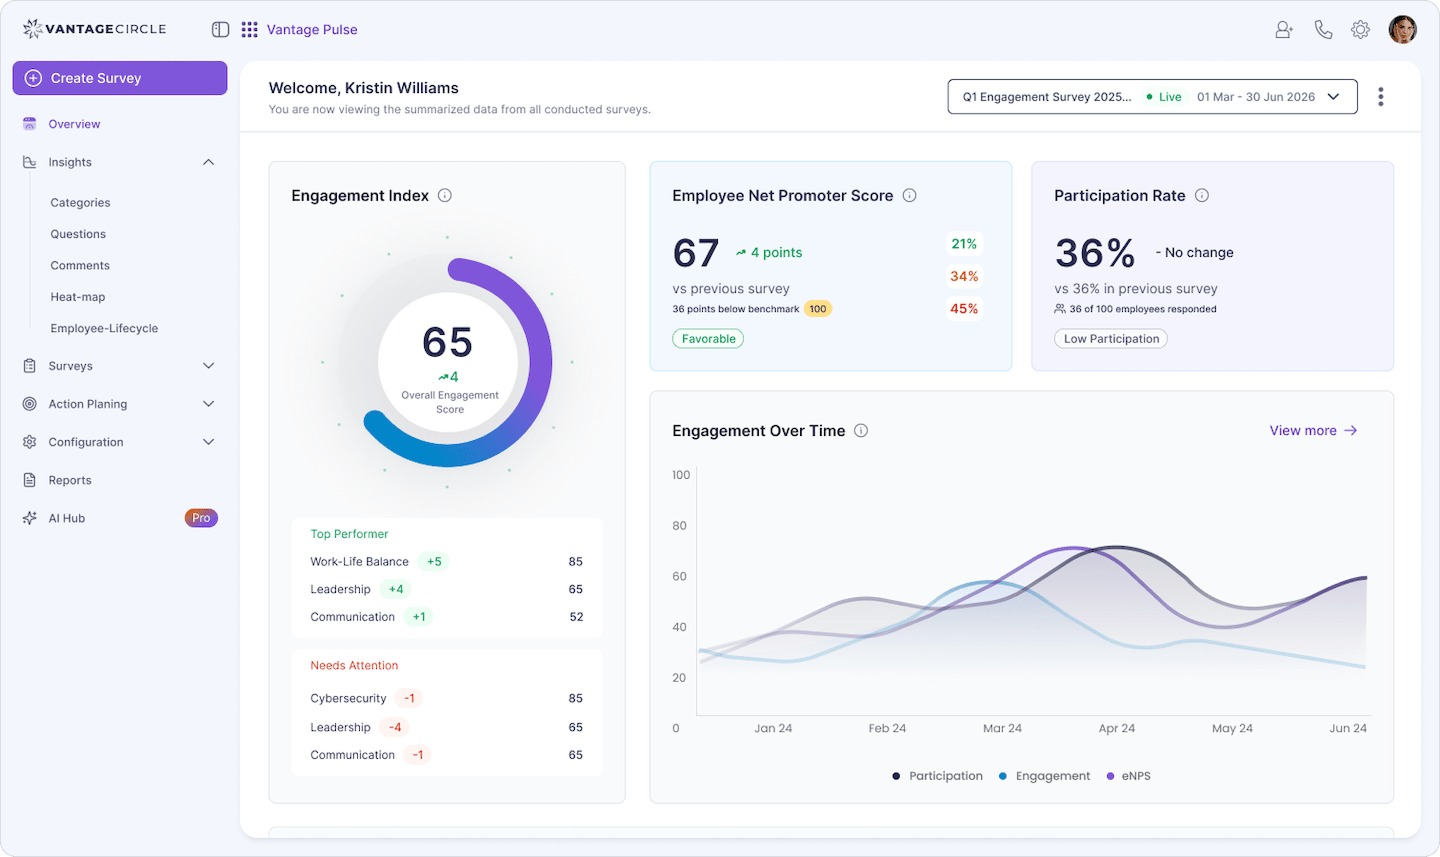 Source: Vantage Pulse
5. Voluntary Turnover Delta Among Recognized vs. Non-Recognized Cohorts
This is the metric finance respects most and HR tracks least.
The voluntary turnover delta compares the turnover rate of employees who received structured recognition in a 12-month period against those who did not. The Recognition Effect (Vantage Circle × Great Place to Work India, 5.7M employees across 2,000 organizations) found that high-recognition cultures see 92% retention versus 76% in low-recognition cultures, a 16-point spread. The same study shows that when employees experience all four emotional recognition signals (Appreciation, Acceptance, Validation, Accomplishment), 97% report intent to stay; when even one of the four drops out, intent-to-stay falls sharply.
I will be honest about the measurement challenge. Isolating recognition as a causal variable is genuinely hard. Recognized employees also tend to have better managers, stronger team cohesion, longer tenure. The delta captures correlation, not clean causation. That caveat does not make the number less useful. It makes it more important to be precise when you present it. Track it via the employee engagement KPIs dashboard, segmented by recognition status.
Recognition Program Benchmark Tables (Built From VC Research)
Most published benchmark tables segment programs by company size or year-since-launch. Vantage Circle's research segments differently, because the data it has is different. The AIRe Report 2024-25 (250 companies across 10 industry segments) and the State of Recognition & Rewards 2025 (352 programs across North America, India, and the UAE) cut by program effectiveness tier, recognition reach quartile, and recognition frequency cadence. The five tables that follow are sourced entirely from VC research.
1. Recognition Reach Distribution (Reality Anchor)
Recognition reach is the share of employees who received at least one formal recognition in the last 12 months. This is what most programs actually report, segmented by quartile of the AIRe Report 2024-25 sample.
| Recognition reach | % of companies in this band | Where a program here sits |
|---|---|---|
| Above 60% | 6% | Top tier. Year 4+ mature programs. |
| 40 to 60% | 13% | Strong. Top quintile. Years 3-4 programs running well. |
| 20 to 40% | 19% | Developing. Above median. Years 2-3 programs. |
| 10 to 20% | 26% | Early-stage. Median band. Year 1 programs. |
| 5 to 10% | 23% | Minimal. Bottom-third programs. |
| Under 5% | 13% | Effectively broken. Manager-led only. |
Source: Vantage Circle AIRe Report 2024-25 (n = 250 companies, 10 industry segments).
Read against this distribution: a Year 1 reach target of 20 to 40% places you above the median. A 40 to 60% target is the top-quintile aspiration for Years 2 to 3. Anything above 60% is mature-state and held by only 6% of surveyed programs.
2. Recognition Frequency Cadence
VC's research measures recognition frequency as the primary cadence companies set for formal recognition, not as a per-user count. The cadence is what drives per-user frequency downstream.
| Primary cadence of formal recognition | % of companies | Typical per-user monthly frequency |
|---|---|---|
| Year-round / anytime | 36% | 1.5+ recognitions per active user per month |
| Quarterly | 28% | 0.3 to 0.8 |
| Monthly | 24% | 0.8 to 1.5 |
| Annual | 10% | Under 0.1 |
| Half-yearly | 3% | Under 0.3 |
Source: Vantage Circle AIRe Report 2024-25.
The AIRe report explicitly recommends spot awards and peer-to-peer recognition for raising frequency. Programs running quarterly-only as their primary cadence almost never reach the 1.5+ per-user monthly operational range that signals real behavioral adoption.
3. Coverage Benchmark (By Employee Segment)
Coverage is the share of employees who are eligible for the R&R program, not the share who get recognized. Per the AIRe Report 2024-25, this is what surveyed companies report.
| Employee segment | Share of companies covering this segment |
|---|---|
| Junior professionals / mid-management | Over 90% |
| Senior management / top management | Over 80% |
| Consultants / contractors | About 60% |
Source: Vantage Circle AIRe Report 2024-25.
The consistent gap is contingent workforce. With contractor share rising in most enterprises, AIRe Report 2024-25 flags this as the segment most likely to drag a program's voluntary turnover delta, because they are recognized least and trusted least to perceive recognition culture as inclusive.
4. Program Effectiveness Tier: Leaders vs Others
The State of Recognition & Rewards 2025 segments programs into Leaders (rated highly effective on engagement, productivity, and behavior) and Others (the comparative group). This is the benchmark to set yourself against if you want to know what mature, high-impact programs do differently from median ones.
| Benchmark metric | Leaders cohort | Others cohort |
|---|---|---|
| AIRe Design Score (0-100) | Average 64 | Average 34 |
| Programs meeting modern design threshold (70%+) | Nearly 40% | Under 5% |
| Recognition anchored on observed behaviors (not just outcomes) | 77% | 27% |
| Balance team + individual recognition | 79% | 37% |
| Use online R&R platforms | About 66% | About 33% |
| Track participation, frequency, and behavioral trends | 9 in 10 | Under half |
| Use escalating rewards / badges / titles for consistent behavior | 60% | 13% |
| Run structured campaigns and storytelling to drive excitement | Over 90% | Under 40% |
| Conduct detailed ROI evaluation | High (linked to 2-3X higher impact) | Under 20% of total sample |
| Annual award spend per employee | Often under USD 100 | Variable, usually higher cash spend |
Source: Vantage Circle × State of Recognition & Rewards 2025 (n = 352 programs across NA, India, UAE).
The Leaders cohort does not outspend on awards. They run leaner award budgets, often under USD 100 per employee per year, and produce higher recognition frequency and reach. What separates them is design discipline and execution rigor, not budget.
5. The Retention Math: Emotional Completeness vs Intent to Stay
The Recognition Effect (Vantage Circle × Great Place to Work India, 5.7M employees across 2,000 organizations) shows the cleanest emotional benchmark in VC research: what happens to intent-to-stay as the number of recognition emotional signals an employee experiences drops. The four signals are Appreciation, Acceptance, Validation, and Accomplishment.
| Recognition completeness experienced | Workplace sentiment | Motivation | Intent to stay |
|---|---|---|---|
| All 4 signals (Advocates) | 98% | 96% | 97% |
| 3 of 4 signals | 83% | 81% | 76% |
| 2 of 4 signals | 60% | 63% | 63% |
| 1 of 4 signals | 33% | 50% | 50% |
| None | 10% | 29% | 29% |
Source: The Recognition Effect (Vantage Circle × Great Place to Work India, 2025).
The gap between full recognition and no recognition is 68 points on intent-to-stay. That is not a margin you make up with compensation. This is the strongest argument for tracking voluntary turnover delta segmented by recognition status.
To anchor the Leaders cohort against a published proof point: Wipro's Winners' Circle program, powered by Vantage Circle, delivered 57% employee recognition coverage in the last fiscal year and 1 recognition every 1.2 minutes across the organization. That is what the top of the AIRe Report's reach distribution looks like in execution: program design discipline, sustained peer-to-peer activity, and frequency that compounds. See employee recognition examples for how organizations across industries have moved from median to top-quartile programs.
Leading vs. Lagging Indicators: Which Comes First
Leading indicators move before lagging indicators. That sounds obvious. Most programs still track it backwards.
I have had this argument with colleagues who insist that eNPS shift is the only number leadership actually cares about. They are not wrong that leadership cares about it. They are wrong that it is the right thing to watch in months 1 through 6. The eNPS shift at 90 days is the first lagging signal you will see. Voluntary turnover delta is not meaningfully measurable until you have 12 months of post-launch data behind you. If you are only tracking lagging indicators, you are flying blind for the first year and reporting a story after the fact rather than steering in real time.
The practical sequence: track participation rate, reach, and frequency in months 1 through 3. Those numbers tell you whether the behaviors are forming. If participation is below the year 1 range by month 3, you have a leading-indicator problem that will surface as an eNPS problem in months 6 through 9 if no one intervenes. Vantage Circle's Engagement Analytics ties recognition activity directly to engagement trends, which is what lets HR predict the lagging-indicator move rather than explain it after it has already happened.
The peer-to-peer recognition behavior is the single biggest driver of recognition reach. If reach is stalling in months 1 to 3, the recovery almost always starts with activating peer recognition rather than pressing managers to do more. Vantage Circle's State of Recognition & Rewards 2025 report quantifies the gap: Leaders adopt peer-to-peer recognition 30 percentage points more often than median programs, and that single design choice does more for recognition reach than any other lever.
How to Calculate Recognition Program ROI
The ROI formula HR can defend to finance has 3 line items: turnover-cost savings, productivity uplift, and program cost. Turnover-cost saving is the most defensible because the cost inputs come from named external research rather than internal estimates.
Calculating turnover-cost savings:
The cost to replace an employee sits at 33% of annual salary for entry-level roles and 150 to 200% for senior roles (SHRM, 2025; Bureau of Labor Statistics, 2025). Use 33% as the conservative floor. If your voluntary turnover delta among recognized employees is 20% lower, and you employ 1,000 people at an average salary of $55,000, the line items look like this:
- Baseline voluntary turnover: 15% (150 employees per year)
- Turnover among recognized cohort: 12% (20% reduction)
- Employees retained due to recognition: approximately 30
- Turnover cost per avoided exit: $18,150 (33% of $55,000)
- Annual turnover-cost saving: approximately $545,000
Productivity uplift:
This is the harder number to nail down, and I would use it cautiously in a finance conversation. Vantage Circle's State of Recognition & Rewards 2025 study (352 programs across North America, India, and the UAE) found that 86% of companies with highly effective programs on engagement and behavioral reinforcement also report high effectiveness on productivity and performance. That is a correlation worth carrying into the ROI conversation, but the problem is that productivity measurement varies enormously by role. Use it as a directional floor, not a primary input, unless you have role-specific output data to back it.
Program cost:
Include platform licensing, program management time, award and reward budget, and manager training. The full cost picture is what separates a credible ROI calculation from a convenient one. Leaving out the management time cost is the most common way this calculation gets gamed.
An analytics layer that surfaces recognition activity, sentiment shift, and turnover data in one place is what turns that ROI conversation from a slide deck estimate into something finance can interrogate. The total rewards business case lives or dies on the integrity of the inputs.
When Your Benchmark Stalls: The Recovery Playbook
The 3 most common recognition benchmark stall points are participation decay after the launch spike, reach concentration in a narrow cohort, and frequency collapse after the initial novelty drains away. Each one has a different recovery pathway.
Stall 1: Participation decay after the launch spike
What I have seen repeatedly is a strong first 90 days, then a gradual slide as the program stops feeling new. The cause is almost always identical: no reinforcement mechanism, and no manager accountability for recognition behavior beyond the initial rollout.
Recovery path:
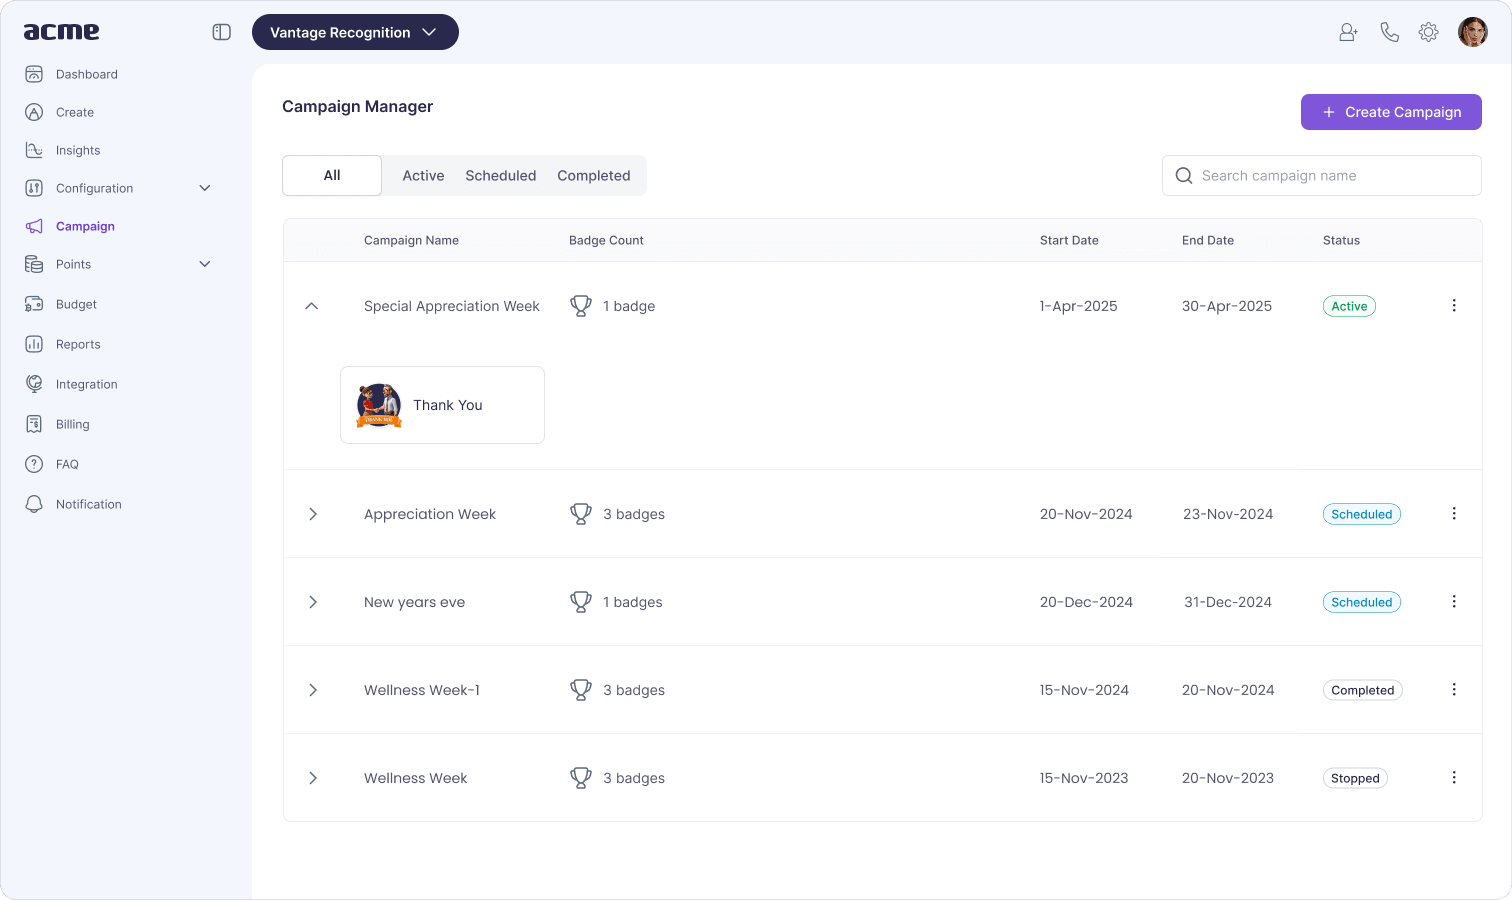
- 30 days: run a focused campaign to reinject visible activity. A values-spotlight month, a peer-shoutout week, a milestone push. Vantage Rewards' Campaign Management feature is built for exactly this scenario.
- 60 days: add recognition to the manager's monthly 1:1 agenda. Not as a metric to report. As a behavior to model.
- 90 days: review whether the recognition criteria are still resonant. Stale criteria produce stale behavior. They almost always do.
 Source: Vantage Recognition and Rewards Platform
Stall 2: Reach concentration
High participation, low reach. 60% of employees are giving recognition and 25% are receiving it. The same people get recognized repeatedly. A large cohort stays invisible.
Recovery path:
- 30 days: activate peer-to-peer recognition if it is not already live. Manager-only programs have a structural reach ceiling that no amount of manager training will move.
- 60 days: run a department-level reach report and share it with team leads. Visibility of the gap is often enough to shift behavior without a formal campaign.
- 90 days: add reach as a team-level metric in the quarterly review so it has accountability rather than just visibility.
Stall 3: Frequency collapse
Frequency drops from 2.5 per active user per month in month 2 to 0.9 in month 6. The novelty wore off and no habit replaced it. That is the pattern, and it is the leading indicator that recognition fatigue has set in.
Recovery mirrors Stall 1 in the early weeks, but the 60-day lever is different: retrain managers on what high-quality recognition looks like rather than just how often to give it. Frequency without quality degrades into box-ticking fast, and employees recognize the difference before the data does.
For a full playbook on building recognition infrastructure that prevents these stalls before they start, see the guide on the employee recognition strategy HR teams use to keep programs from drifting.
Set Benchmarks Your Leadership Sponsor Will Actually Trust
The programs that lose sponsorship are not the ones that miss a target. They are the ones that set a target no one believed from the start, miss it, and then try to explain why the metric was flawed rather than the execution.
Setting realistic recognition program benchmarks is not about lowering the bar. It is about building a measurement infrastructure that tells a true story: where we started, what we aimed for, where we are, and what happens next. The 5-step framework in this article gives you that infrastructure. The 5 VC-sourced benchmark tables give you defensible ranges to anchor against. The recovery playbook gives you the next action when something stalls, before the quarterly review becomes a difficult conversation.
 Source: Vantage Recognition and Rewards Platform
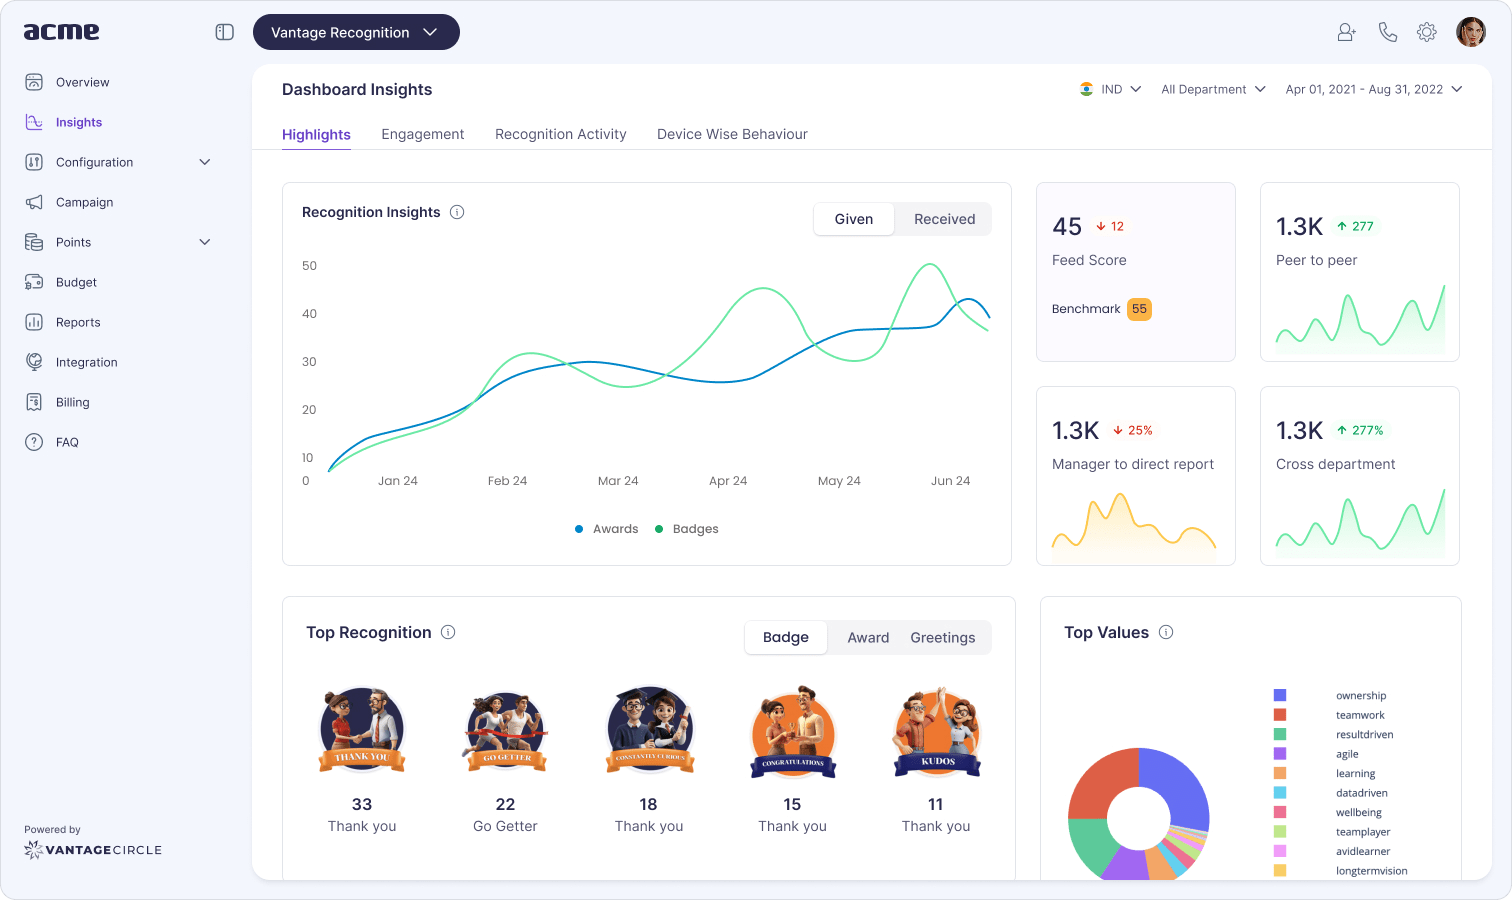
Programs that last are the ones where HR walks into a sponsor meeting with a clean data story rather than a directional narrative. Vantage Rewards surfaces recognition activity, engagement trends, and sentiment data in one place, which is what makes that conversation possible without a manual data pull the night before the meeting.
Frequently Asked Questions
Q: How can you measure recognition program success?
A: Track 5 metrics: participation rate, recognition reach, recognition frequency, eNPS shift, and voluntary turnover delta. The first three are leading indicators that move in months 1 to 3. The last two are lagging indicators that confirm results at the 90-day and 12-month marks. Start from a 30-day baseline and review quarterly.
Q: What are the statistics on employee recognition programs?
A: Per The Recognition Effect (Vantage Circle × Great Place to Work India, 5.7M employees), only 55% of employees feel truly recognized, and high-recognition cultures see 92% retention versus 76% in low-recognition cultures. Vantage Circle's AIRe Report 2024-25 adds that 67% of organizations targeting behavioral reinforcement report high R&R effectiveness, against less than 50% targeting loyalty alone.
Q: What are the key metrics for an employee recognition program?
A: Participation rate, recognition reach, recognition frequency, eNPS shift, and voluntary turnover delta. The first three are leading. The last two are lagging. Tracking only lagging indicators means the first year of program data is essentially invisible to you.
Q: What is a good participation rate for a recognition program?
A: Read it against Vantage Circle's AIRe Report 2024-25 distribution. Across 250 surveyed companies, only 6% recognize more than 60% of employees in a year, 19% clear 40%, and almost half sit below 20%. A Year 1 reach target in the 10 to 20% band puts you at the AIRe median; 20 to 40% in Years 2 to 3 moves you above two-thirds of the sample; mature programs sit in the top quintile at 40%+.
Q: How do you calculate the ROI of an employee recognition program?
A: ROI = (Turnover-cost savings + Productivity uplift - Program cost) / Program cost x 100. Anchor turnover-cost savings using SHRM's 33%-of-annual-salary replacement benchmark, then apply your voluntary turnover delta to total headcount. Subtract full program cost including management time, not just platform and rewards budget.

He has worked in the human resources environment and has elevated recognition and rewards through his insightful and detailed writing. He aims to enhance the practice of Recognition in the workplace with new ideas and innovation that will help shape the work culture. For any related queries, contact editor@vantagecircle.com