What Is Employee Attrition Rate? (And How Do You Evolve from Tracking It to Predicting It?)
A Global Employee Recognition and Wellness Platform
You're losing people. But here's the question you need to ask: Are you losing the right ones?
Most leadership teams treat attrition like a four-letter word—something to minimize, combat, and fear. However, not all attrition is bad.
Sometimes, a shrinking headcount is exactly what your business needs. Other times, it's a slow-motion crisis you're not seeing until your best people are already out the door.
McKinsey found that 40% of employees who quit during the Great Resignation cited lack of career development as a primary reason yet only 25% of organizations had made meaningful changes to their advancement programs even a year later.
The gap between what's causing attrition and what leadership is actually addressing? That's where the real problem lives.
Understanding what attrition means, why it's happening, and whether you're in control of it or it's controlling you.
Let's cut through the HR jargon and get to what matters: the real story your attrition rate is telling you, and what you should actually do about it.
Key Takeaways
- Understand what attrition rate and employee attrition is
- Know how the calculator works and the formula behind calculating attrition
- Understand the true cost of attrition
- How can you predict attrition before it happens?
- What are the proactive strategies to reduce attrition?
What is Employee Attrition?

Employee attrition is when people leave your organization, and you don't replace them. Unlike turnover, where you hire someone new to fill the gap.
Attrition means that the role has either disappeared, or it remains vacant. Think of it as natural workforce reduction where people exit; headcounts shrink.
What is the Attrition Rate?

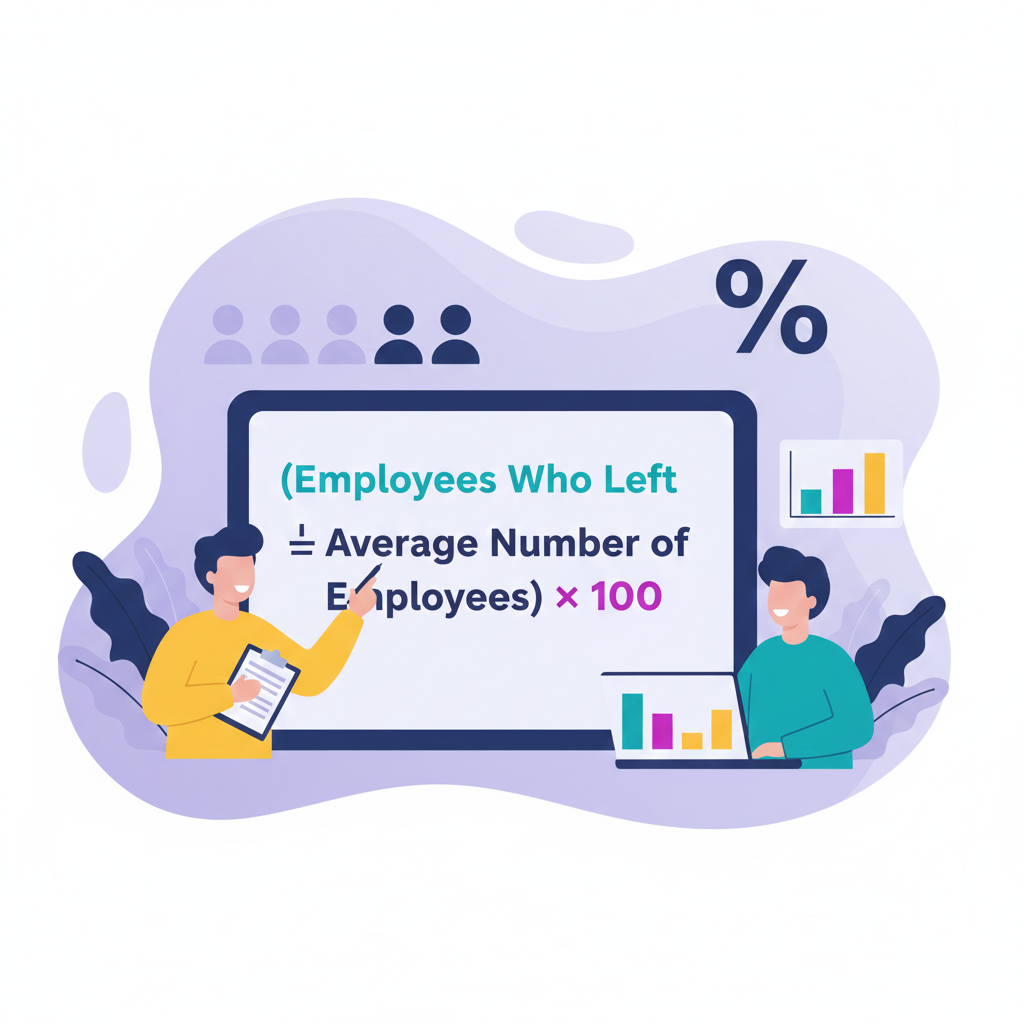
The attrition rate measures the percentage of employees leaving the organization over a specific period without any replacement.
It is calculated by dividing the number of employees who left by your average number of employees and then multiplying by 100.
This metric tells you how quickly your workforce is reducing and whether that reduction is helping or hurting your business.
How Is Attrition Different from Turnover and Layoffs?
Let's clear up the confusion that trips up even seasoned leaders:
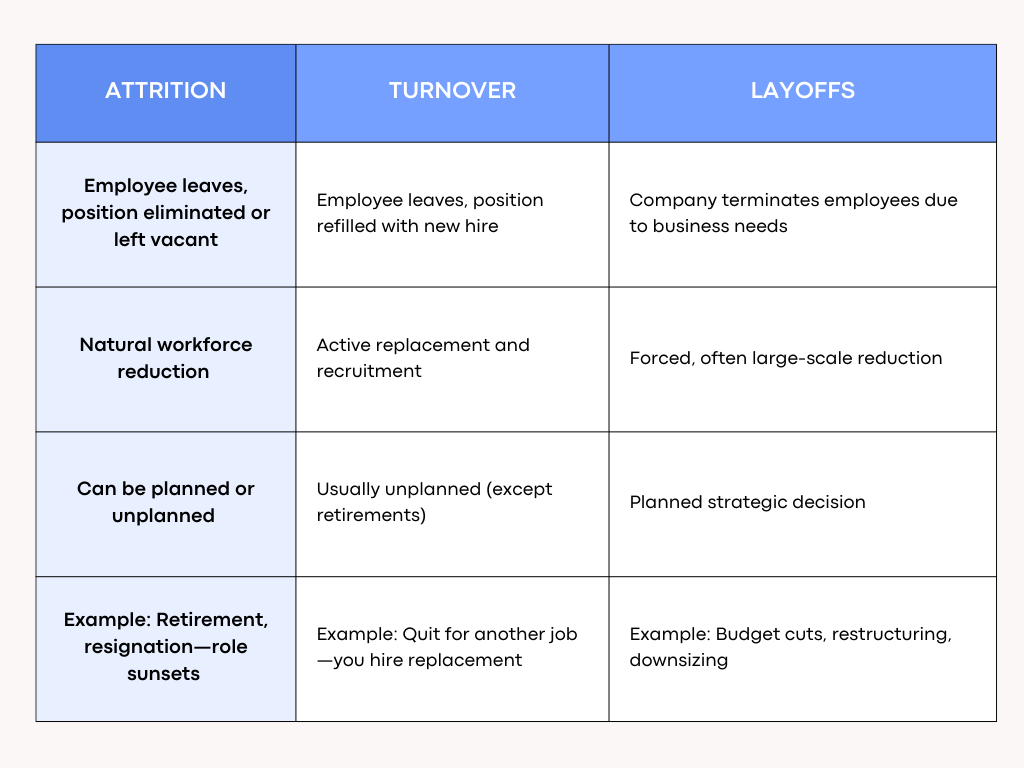
The key difference? Attrition reduces headcounts. Turnover maintains it. Layoffs force it.
What Are the 4 Main Types of Attrition?
1. Voluntary Attrition
Employees choose to leave the organization through resignations, retirements, and career changes. You didn't push them out; they walked on their will.
2. Involuntary Attrition
You make the call to terminate the workforce due to their performance, misconduct, or poor organizational fit. The employee didn't choose to leave.
3. Internal Attrition
Employees leave their department or team but stay with the company. It happens due to promotions, transfers, or internal moves. Your organization retains the talent; the team loses it.
4. Demographic-Specific Attrition
Exits concentrated in groups like new hires leaving within 90 days, women in leadership roles, or Gen Z employees. These patterns reveal deeper systemic issues.
How Do You Calculate Your Attrition Rate? (With Calculator Included)
Calculating attrition rate is not complicated but getting it right matters. The standard formula is:
Step-by-Step Calculation:
-
Count departures – Track every employee who left during that period (resignations, retirements, terminations).
-
Calculate average headcount – Add your starting headcount to your ending headcount, then divide by 2.
Example: Started with 100 employees, ended with 90 = (100 + 90) ÷ 2 = 95 average employees
Based on the data provided by SHRM, the desired attrition should be below 10%. And the most accurate data can be obtained through a rolling 12-month calculation. Why? Because it smoothens out seasonal anomalies and short-term fluctuations.
Interactive Attrition Rate Calculator
This rate is your starting point. Now, let's find its financial impact.
Attrition Rate Calculator
What Is the True Cost of Attrition? (And How Do You Calculate It?)

Gallup estimates that replacing a single employee can cost anywhere from one-half to twice their annual salary, and U.S. businesses collectively lose roughly $1 trillion annually to voluntary turnover. This is where attrition stops being an HR metric and a serious problem.
However, most finance teams miss the full picture of hidden costs that bleed revenue when someone leaves.
Let's introduce the metric that actually gets C-Suite attention: Cost of Attrition (CoA).
The 4-Part Formula for Cost of Attrition
CoA is not just a number. It is a layered calculation that captures the true financial hemorrhage:
CoA = Separation Costs + Vacancy Costs + Replacement Costs + Training Costs
Here's what lives inside each bucket:
1. Separation Costs
This is the immediate cost when someone drops their paper and leaves. SHRM data has revealed that executive cost-per-hire has increased to $10,625. This is a striking 113% increase from 2017 and 21% rise from 2022.
What you're paying for:
-
Exit interview time (HR + manager hours)
-
HR administrative work (offboarding paperwork, system access removal)
-
Severance packages (if applicable)
-
Temporary coverage or overtime for remaining staff
-
Knowledge transfer sessions (if you're lucky enough to get them)
2. Vacancy Costs
The real damage occurs when there are empty vacancies and no one fulfills those responsibilities. Around two-thirds of all turnover-related costs are intangible, mainly from lost productivity and organizational knowledge. (Source)
The cost drivers:
-
Lost productivity as employees work at 40-60% capacity due to knowledge gaps and workflow disruptions.
-
Overtime pay for team members picking up slack
-
Project delays that push revenue recognition into future quarters
-
Missed deadlines that damage client relationships
3. Replacement Costs
To replace the employee who left it requires planning and investment. It means you have to again tap in the job market and search for the right talent.
What adds up:
-
Job posting and advertising fees across multiple platforms
-
Recruiter fees (typically 15-25% of first-year salary for external agencies)
-
Interview team's time (manager, peers, executives—multiply their hourly rates by hours spent)
-
Background checks and drug screening
-
Pre-employment assessments
-
Offer negotiation time
4. Training Costs
According to the Association for Talent Development, organizations spend around $1280 per employee on workplace training. Given the current job market, that is a huge number.
The breakdown:
-
Onboarding materials and system setup
-
New hire's salary during 3-6 month ramp-up period (they're paid full salary while producing at 30-50% capacity)
-
Manager's training time (often 15-20 hours in first month alone)
-
Peer mentoring hours
-
Lost engagement from remaining team members who see colleagues leave—50% of employees with a best friend at work report feeling a stronger connection to their organization, making departures emotionally costly
Example of Cost of Attrition: The $80K Employee
Let's run the numbers for a mid-level employee earning $80,000 annually. Watch how quickly this multiplies:
Separation Costs: $6,000
-
10 hours of exit interviews and knowledge transfer (manager + HR) = $1,500
-
Administrative offboarding = $500
-
Two weeks of reduced team productivity = $4,000
Vacancy Costs: $7,700
-
Role vacant for 8 weeks (industry average)
-
Lost productivity at 50% = ($80,000 ÷ 52 weeks) × 8 weeks × 0.5 = $6,154
-
Overtime for coverage = $1,546
Replacement Costs: $14,000
- Job posting ads = $1,000
8 Recruiter fee (15% for external hire) = $12,000
- Interview team time (5 people × 4 hours × $75/hour) = $1,500
Training Costs: $14,400
-
Onboarding materials = $800
-
New hire at 40% productivity for 12 weeks = $9,231
-
Manager training time (20 hours × $100/hour) = $2,000
-
Peer mentoring = $2,369
Total Cost of Attrition: $42,100
That's 1.53x for the employee's annual salary. These are just estimates to show how attrition can hurt the overall finance. For senior roles or specialized positions? Costs can reach 200-400% of salary for executive-level positions.
Multiply that by just 10 employees leaving this year, and you're looking at $421,000 in attrition costs. Now do the math and imagine the actual attrition numbers.
How Do You Analyze Attrition Beyond a Single Number?

Here’s an uncomfortable truth: your company-wide attrition rate is almost useless. Shocking, isn’t it?
To put things into perspective, you might have a low attrition rate say 5%, but you are hemorrhaging talent. On the contrary, you can have a 15% rate but a solid and efficient workforce.
The numbers themselves are not self-explanatory at times. What matters most is who’s leaving and whether you want them to stay.
Research by Gallup has found that 42% of employee turnover is preventable but often ignored. Why? Because most leaders still track attrition as a single metric that hurts the overall finances.
Let's break down the analysis that actually matters.
Analysis 1: What is Performance-Based Attrition? (The "Regrettable Attrition" Report)
This is the most critical analysis you can run. It tells you whether your attrition is killing you or making you stronger.
Here's the framework:
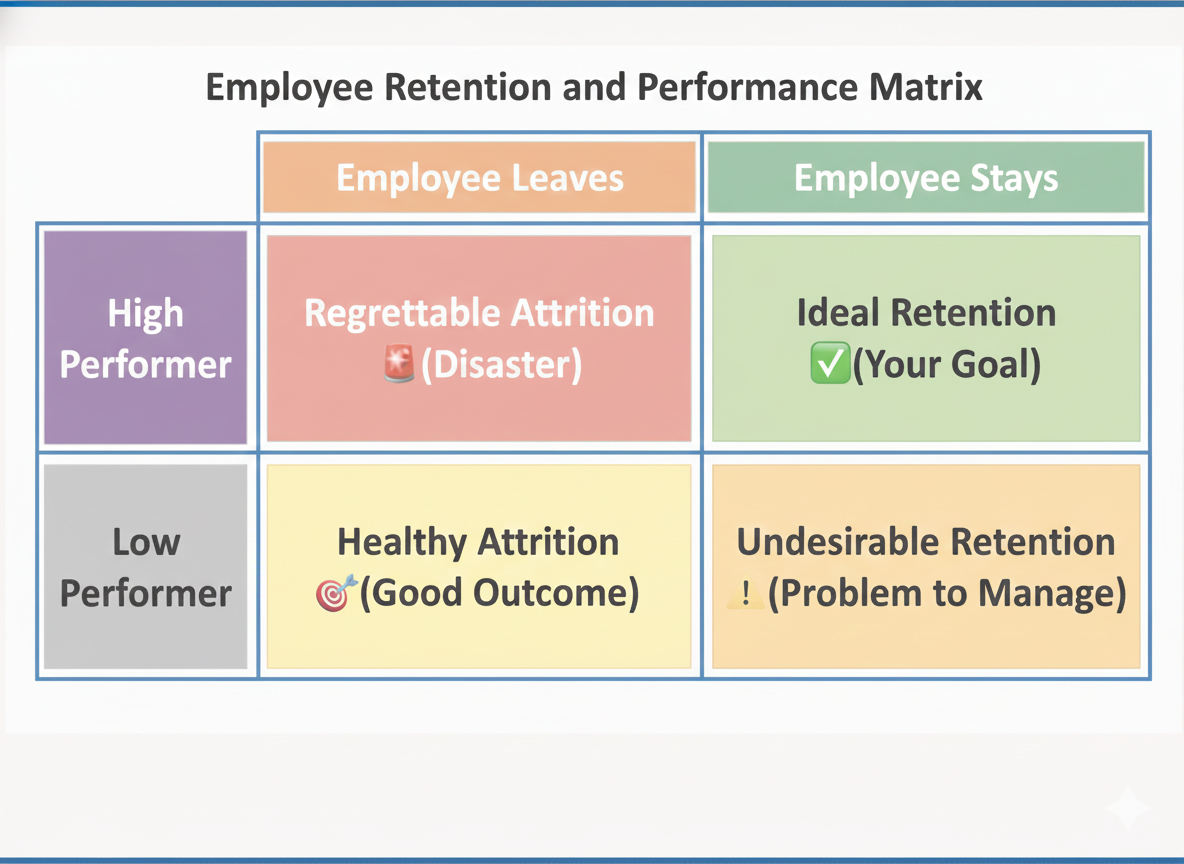
Why this example matters:
Imagine your company has 100 employees and a 5% attrition rate. This signals that only five people left this year.
Scenario A (The Crisis):
The five people who left were your top performers, bringing in a revenue of $500k each annually.
What does it mean for your organization? That is a 5% regrettable attrition rate, and you just lost $2.5M in annual revenue. In addition, there is loss in the form of institutional knowledge, client relationships, and team morale.
You can see the issue here. The attrition rate might seem low, but the cost in the longer run is very high. Get to the root of the issue of why they left and fix it immediately.
Scenario B (The Win):
Now flip the scenario. The five people who left were your lowest performers with performance improvement plans.
That is 5% of healthy attrition as your organization’s productivity goes up. Team morale improves as underperformers dragging their peers and creating frustration.
This is strategic workforce optimization, not a retention failure.
The brutal reality: According to commentary on BLS data, the total annual separations rate in 2020 was reported as 57.3%. Some industry summaries then suggest that the attrition of high‑performers might be around 3%. If your high‑performer attrition exceeds 5%, it’s often seen as a red‑flag. (Source)
Amazon learned the lesson in an expensive way in 2022 when their business practices of churning through workers drove their attrition costs to an estimated $8 billion annually. That number was way above industry averages. When regrettable attrition goes unchecked, it doesn't just cost money. It damages culture, competitive advantage, and your ability to attract future talent.
How to calculate your regrettable attrition rate:
**Regrettable Attrition Rate = (Number of High-Performer Departures ÷ Total High Performers) × 100 **
For example, if your company has 200 employees with 40 identified as high performers, and you lose 8 of them in a year, your regrettable attrition rate is 20%. That is four times worse than it appears in your overall attrition metric.
The action step:
If your number seems “low” then stop celebrating it. Instead, segment it by performance.
A 10% overall rate with 2% regrettable attrition? You're doing great. A 10% overall rate with 8% regrettable attrition? You're slowly bleeding to death.
Track both numbers. One tells you volume and the other tells you survival. Analyze according to those numbers and take action that will benefit the organization.
Analysis 2: What is Tenure-Based Attrition? (The "Retention Cliff")
Your attrition rate hides a critical story: when people are leaving. Plot exits by tenure, and you'll spot exactly where your employee experience breaks down.
Segment by these bands:
-
0-90 days (Early attrition)
-
3-12 months (First-year attrition)
-
1-2 years (Post-onboarding cliff)
-
3-5 years (Mid-career exits)
-
5+ years (Veteran departures)
Why timing reveals everything:
Nearly 38% of employees quit within the first year, with 29% leaving in the first 90 days alone. If you're seeing a spike in the first three months, your problem isn't retention—it's hiring or onboarding. 88% of employees believe they aren't given a good onboarding program, and it shows in early exits. (Source)
A massive spike at the 1-year mark? Your first-year experience is broken. Employees are giving you 12 months to prove it's worth staying—and you're failing that test.
Exits clustering at 2-5 years? That's your growth ceiling showing. Average employee tenure has dropped from 4.5 years in 2022 to 4.2 years in 2024, meaning mid-tenure employees are leaving faster than ever because they see no path forward.
How to find your retention cliff:
Pull departure data, calculate tenure for each exit, group into bands, then calculate the attrition rate for each segment. A spike at any single point is your red flag—and your roadmap for where to fix things.
A 30% attrition rate in the first 90 days? Fix hiring and onboarding. A spike at 12 months? Fix career development. A surge at 3-5 years? You have a growth ceiling problem.
The cliff shows you exactly where to invest—or where to stop wasting money.
Analysis 3: What is Departmental Attrition? (The "Hotspot Report")
Departmental attrition occurs when people leave a particular department like Sales, HR, or Engineering over a period. The company-wide attrition rate does not give you the real story. To dig deep, you need a departmental breakdown that reveals the actual crisis.
Look at this example:
The Recognition Effect (GPTW × Vantage Circle, 2025 shows that when recognition is strong, 97 % of employees intend to stay, compared to just 10 % where it’s absent. Gartner (2023) finds 57 % of Chief Sales Officers report above-target attrition, marking Sales as the highest-risk function.
Meanwhile, Ravio (2026) data from European tech reveals Operations holds the highest attrition at 21.3 %, while Engineering remains the most stable, confirming that recognition equity and leadership fairness directly shape retention outcomes.
This disparity points directly to three culprits:
1. Leadership issues
Reassess the leadership capabilities if a particular department has high attrition. If there is toxicity, micromanagement, or lack of support, it drives people out faster.
Try to gain real feedback from team members and keep them anonymous. You can try out pulse surveys with the appropriate questions that will guide you to the root cause.
If leadership is inclined towards negativity, then train them on becoming a better leader. Once you figure out the issues, take the necessary steps to resolve them.
2. Compensation gaps
Some departments get competitive packages with bonuses while others don’t. The disparity in compensation compared to the market rate can speed up departmental attrition.
Hence, it is critical to meet the market standards to align the workforce towards a common goal.
3. Recognition and growth
Departments with clear career paths and visible wins retain better. On the contrary, if employees feel stuck, undervalued, or invisible, they leave. As per the data, operations attrition jumped 21% as roles were automated or absorbed into other functions, leaving employees uncertain about their future.
The action: Pull your attrition data by department quarterly. Any department exceeding your company average by 5+ percentage points is a hotspot that needs immediate attention. Don't wait for exit interviews to tell you what the data already screams.
How Can You Predict Attrition Before It Happens?

Most attrition is preventable, but you need to catch the warning signs early. This is where HR leaders need to control the damage with strategic prevention.
Exit interviews tell you what went wrong. Flight risk analysis tells you what's about to go wrong. This gives you the required time to fix the grey areas.
What are the Top 5 "Flight Risk" Indicators?
These five signals should trigger immediate action:
1. Drop in Engagement
According to Gallup, employee engagement in the U.S. fell to its lowest level in a decade in 2024, with only 31% of employees engaged. This data is alarming and signals one key point. When engaged employees stop responding to surveys or give lower ratings, it’s a sign of mental withdrawal.
What can you do? Regular engagement tracking helps HR leaders catch this decline before it turns into resignation letters.
2. Change in Behavior
High performers don’t announce they will leave until their decision is made. However, they have certain behavior shifts like:
-
Collaboration reduces from their end.
-
No active participation during meetings.
-
Low engagement in recognition platforms.
What can you do? Identify the behavior shifts and have a one-on-one meeting. Once you understand the root cause of their engagement make a strategic plan to tackle it.
3. Manager Quality
Managers have a significant role in retention. Gallup found that managers account for 70% of the variance in employee engagement scores. However, with poor management practices it costs the U.S. economy an estimated $300 billion annually due to lost productivity.
In short: Employees don’t leave companies; they leave bad managers. Tracking manager effectiveness alongside engagement data gives you one of the strongest predictors of turnover risk.
4. Key "Trigger" Events
There are certain events in an employees’ journey that work as a trigger factor. Some of the most common ones are:
-
Promotion denials
-
Wrong negative performance reviews
-
Lack of recognition on anniversaries
-
Change in leadership changes.
According to Gallup, more than half of employees who quit say their manager or organization could have done something to prevent it.
These trigger moments allow HR to take timely action with the help of surveys and genuine feedback.
5. Compensation and Development Opportunities
Career growth and learning opportunities are as essential as pay. They are power retention levers. In US frontline retail workers, a lack of career development and uncompetitive compensation were identified as the two most important factors contributing to departure decisions as per McKinsey.
This signifies the importance of supporting your employees in terms of development and upskilling.
The Action Step
Build a simple flight-risk scoring system that flags employees showing multiple indicators. The indicators include:
-
Low engagement scores.
-
Declining manager ratings.
-
Recent trigger events.
The goal is not perfection but pattern recognition. Predict early, intervene with empathy, and retain your best talent.
What Are the Proactive Strategies to Reduce Attrition?

When does retention strategies fall apart? It’s a question you need to ask often if you are dealing with attrition.
The answer: It falls apart when they are reactive, generic, and ineffective.
If “pay people more” is your retention strategy then it works as a band-aid on a bullet wound. It will never work.
According to Gallup, 59% of employees cited greater work-life balance and better personal wellbeing as the reason to look for a new job opportunity.
You can see that money is not the real issue. The companies winning at retention are not throwing money. They are surgical, strategic, and proactive. How? Let’s have a look.
Strategy 1: Fix Your “Hotspots” (Act on Your Analysis)
You might have seen some departmental spikes during your tenure as a leader. The regrettable attrition rates are high in those departments. Those are not just your numbers; it’s the area where you need to focus.
Only 42% of voluntary turnover is preventable, according to Gallup’s analysis of exit data—meaning 58% of what you might call “flight risk” could have been addressed before resignation. (Source: Gallup)
If your sales department is bleeding at 31% while Engineering holds at 12%, don’t launch a company-wide engagement initiative. Target sales leadership, compensation structure, or workload distribution.
According to iHire’s 2024 Talent Retention Report, many people quit their jobs due to management and company culture issues, including a problematic environment (32.4%), poor leadership (30.3%), and dissatisfaction with managers (27.7%). (Source: iHire)
Target your strategies where the data directs. Don’t waste resources on trying things that won’t turn into results.
Strategy 2: Implement “Stay” Interviews
There are two sides to conducting exit interviews and stay interviews.
Exit interviews tell you what went wrong after it’s too late. Meanwhile, stay interviews draw a picture of what’s about to go wrong. Hence, stay interviews are crucial that allow you to fix the grey areas.
Here is what you can do-
-
Ask your top performers these questions quarterly: “What would make you leave?”, “What makes you stay?”.
-
Choose high-value employees with a good performance rating for quarterly analysis. Do it with all the teams on a yearly basis.
The answers they give you aren’t hypothetical—they’re your retention roadmap.
Strategy 3: Build a Recognition-First Culture
Gallup research has indicated that employees who receive high-quality recognition are 45% less likely to leave their jobs.
Now that is a significant game-changer if your aim is to reduce attrition.
Yet only 1 in 3 employees strongly agree they received praise in the last week—and workers who don’t feel appreciated are nearly 2× as likely to look for a new job. (Source: Gallup)
Recognition is not your typical “employee of the month” plaques anymore. It is so much more than that. It is about getting seen, having value, and getting the necessary acknowledgment for fulfilling their work.
Companies need to make employee recognition a priority and create a culture where small or big wins are celebrated equally.
This is where platforms like Vantage Circle transform retention from concept to execution. These recognition platforms make recognition visible, frequent, and embedded into daily workflows. They provide a plethora of features that are easy to use while having the right amount of gamification.
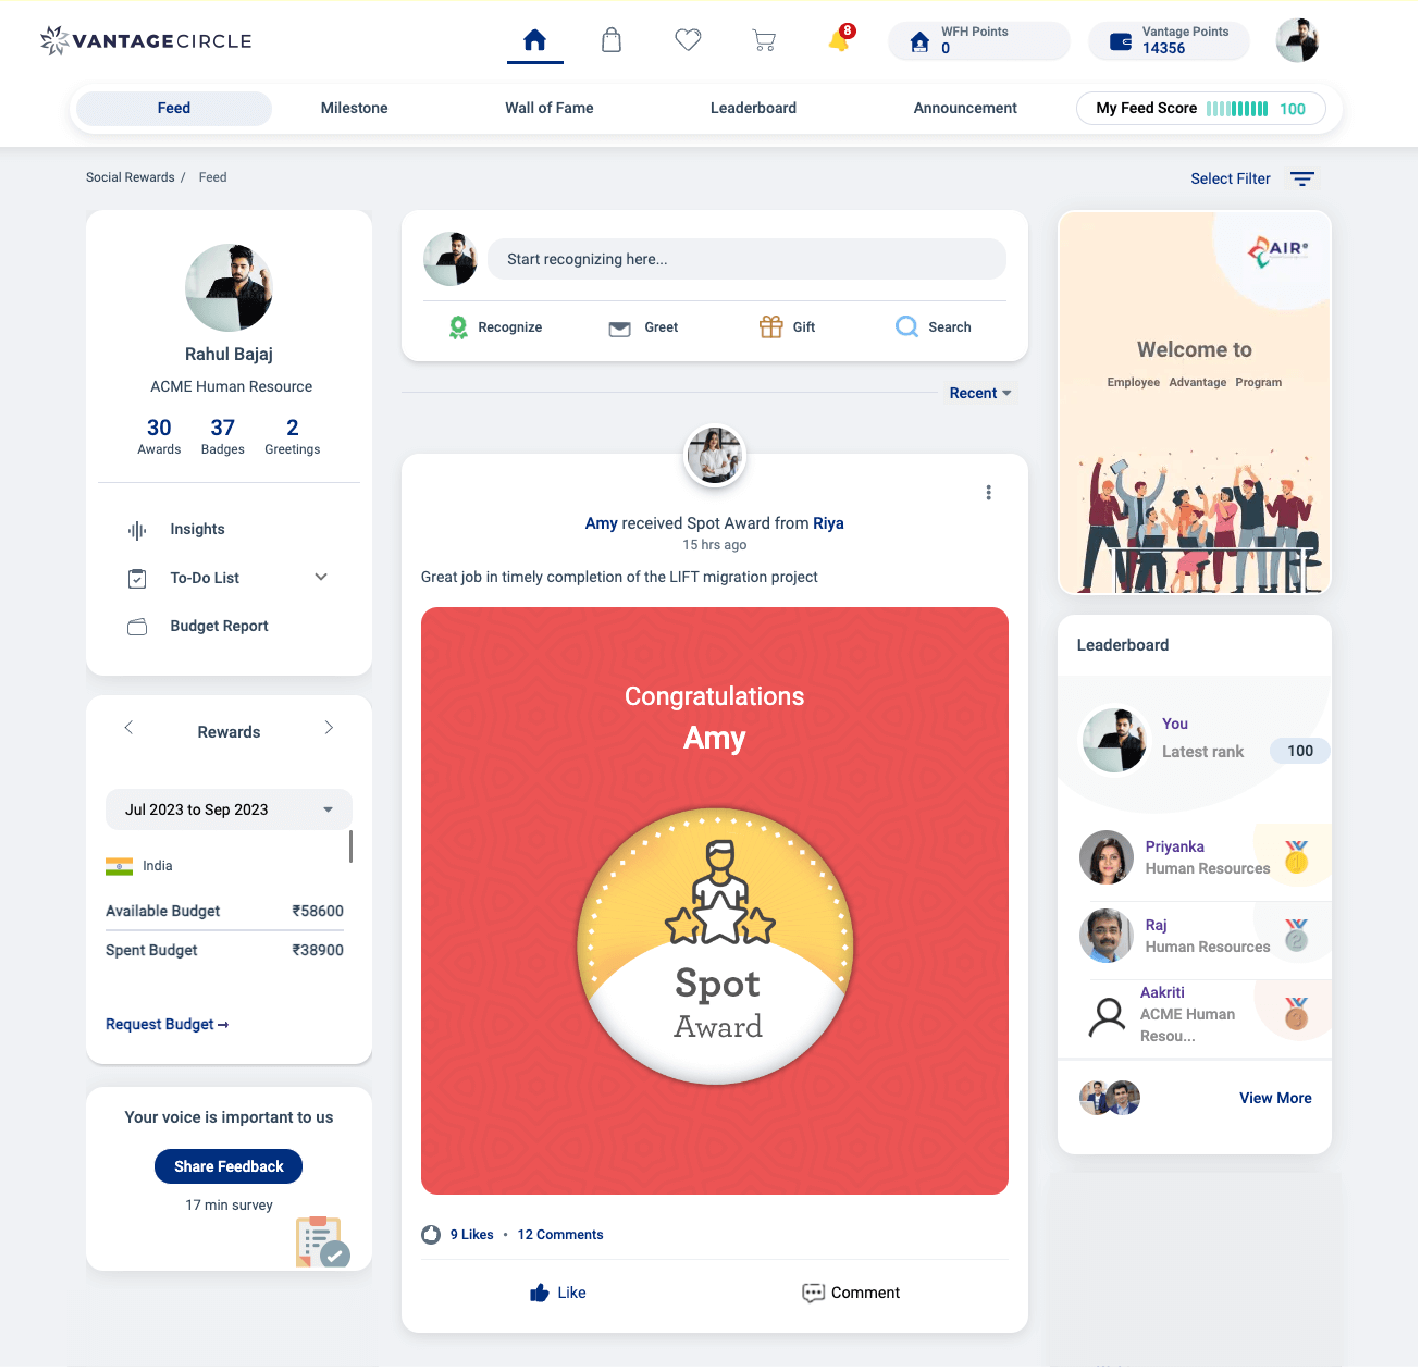
(Source: Vantage Recognition)
When high performers see their contributions valued in real-time, they don’t quietly browse LinkedIn. They stay.
Strategy 4: Create Transparent Career Paths
According to Gartner, just 46% of employees feel supported to grow their careers in their current organization.
If there is a lack of growth, employees cannot see a path forward. Even if you provide them with good promotion but no skill development, they will leave.
High-performers need to visualize their future with you with adequate learning and upskilling. If you cannot provide it, they’re visualizing it somewhere else. And they will be gone even before you know it.
Hence, it is crucial that you have a transparent career path laid down for your employees in the right time. Lay it out to them and show them their trajectory of growth. When they see a positive plan, they will stick with you for a longer time.
Conclusion!
Your attrition rate isn't just a metric—it's a mirror reflecting your organization's health.
The companies that win at retention aren't chasing perfection; they're chasing clarity. They know who's leaving, why it matters, and what to fix first. Stop treating attrition as something that happens to you. Start treating it as something you control. The data is already talking. The only question left: Are you listening, or are you waiting for your best people to answer for you?

Mrinmoy Rabha is a content writer and digital marketer at Vantage Circle. He has worked in the human resources environment and has elevated recognition and rewards through his insightful and detailed writing. He aims to enhance the practice of Recognition in the workplace with new ideas and innovation that will help shape the work culture. For any related queries, contact editor@vantagecircle.com
")