What is HR Analytics? A Simple Guide to Understanding and Using It
A Global Employee Recognition and Wellness Platform
Imagine this scenario: You're in a boardroom, the pressure is on, and the CEO asks, "How do we improve employee engagement?" You've got the data, but it's scattered across multiple systems. You are unsure about how you can convert the scattered data into meaningful action. This is where HR analytics comes to your rescue.
By transforming raw data into clear insights, HR analytics empowers leaders to make smarter decisions, from reducing turnover to boosting engagement and performance.
It's not about crunching numbers for the sake of it; it's more about using data to shape a better employee experience and drive measurable outcomes.
To gain a detailed understanding of HR analytics, this blog will be a valuable resource. We'll explore what HR analytics is, why it's a game-changer for HR professionals, and how you can use it to make more informed and impactful decisions.
What is HR Analytics?
HR analytics is a practice that involves collecting, analyzing, and interpreting workforce data to improve decision-making and business outcomes. Rather than relying on intuition or anecdotal evidence, analytics enable leaders to make informed, evidence-based decisions.
But here's something that needs your attention: HR analytics isn't about data for the sake of data. It is about utilizing the data to resolve fundamental issues, such as reducing turnover and improving engagement.
You might wonder why now? The rise of hybrid and remote work, rapidly changing employee expectations, and the war for talent have made workforce insights increasingly valuable.
Around 15 years ago, HR analytics was primarily descriptive, reporting headcounts, attrition, or time to hire. Today, it has evolved into predictive and prescriptive analytics, shedding light not only on 'what happened' but 'what might happen next' and 'what to do about it'.
A study reveals that the Global HR Analytics Market was valued at USD 3.3 billion in 2023. This market is projected to reach USD 9.9 billion in 2032 at a CAGR of 13.4% between 2023 and 2032.
Types of HR Analytics
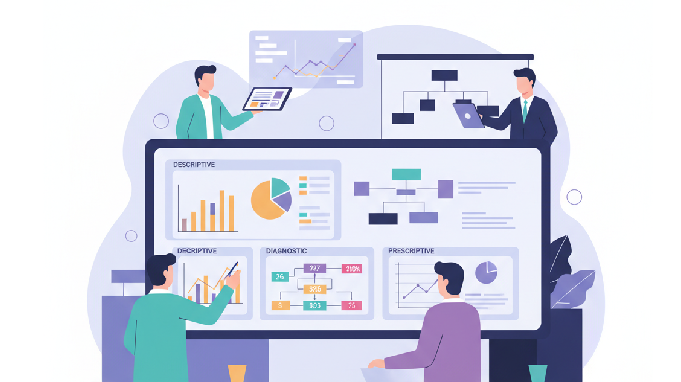
The operation of HR Analytics is broken down into four key types, each one building upon the other.
1. Descriptive Analytics – Reveals "What happened?"
This is the first step. It looks at past data to explain trends.
Example: Analyzing quarterly attrition reports to figure out that 15% of employees left customer service roles.
Why it matters: It helps HR spot patterns quickly (e.g., turnover spikes after six months of tenure).
2. Diagnostic Analytics – Reveals "Why did it happen?"
This type of analytics digs deeper to uncover the root causes.
Example: Exit interviews reveal that most customer service employees left due to limited growth opportunities.
Why it matters: It puts an end to guesswork and identifies the "why" behind numbers.
3. Predictive Analytics – Highlights "What might happen?"
This analytics uses data modeling to forecast future outcomes.
Example: Using historical attrition trends, HR predicts that 1 in 5 customer service employees could resign within the next quarter if no changes are made.
Why it matters: Leaders get insight and can prepare in advance instead of reacting to crises.
A Gartner workforce study found that companies integrating predictive data analytics into HR technology experience a 30% increase in employee retention and a 25% improvement in workforce productivity.
4. Prescriptive Analytics – Highlights "What should we do?"
Being the most advanced form of analytics, it recommends concrete actions.
Example: Suggesting a career development program and mentoring opportunities to reduce risk in customer service.
Why it matters: It helps HR put the insights into action and create the necessary impact.
Together, these categories of analytics compile as a powerful toolkit that transforms the role of HR from a mere execution function into a proactive driver of strategic business outcomes.
Benefits of HR Analytics: Why It's More Than Just Numbers

Just having numbers at your disposal will not transform businesses, but when these numbers are used to drive tangible outcomes, they can become valuable. Let's understand its benefits across three dimensions:
1. Strategic Benefits
HR analytics perfectly aligns talent with business goals. This alignment enables leaders to forecast workforce needs, assess skill gaps, and plan the future.
Example: A tech company predicted demand for cloud engineers six months before a new project launch, ensuring talent was ready when needed.
2. Operational Benefits
Analytics enhances efficiency and reduces costs. It unlocks insights on which recruitment channels work best, how training budgets are spent, and where bottlenecks exist.
3. Cultural Benefits
Analytics assists in strengthening culture. By tracking DEI, engagement, and well-being, HR analytics ensures that employee experience stays at the heart of business growth.
Common Used Cases of HR Analytics
Moving beyond theories, let's explore some practical ways organizations are applying HR analytics in practice:
-
Predicting attrition: It has helped in identifying employees at risk of leaving and allows for intervention through recognition and career development opportunities.
-
Optimizing hiring: It's been used for identifying the most effective sourcing channels and reducing time to fill roles.
-
Measuring engagement: Using survey data to connect engagement scores with productivity.
-
Improving DEI: Tracking promotion rates across gender and ethnicity to spot gaps.
-
Forecasting workforce demand: Anticipating skill shortages for future projects.
-
Reducing absenteeism: Using attendance and health data to predict burnout risks.
-
Evaluating learning programs: Measuring how training impacts performance, promotions, or revenue contribution.
Each of these used cases ties HR closer to measurable business impact.
As per an Economic Times article, a survey by SkyQuest found that Workforce analytics can significantly impact business outcomes.
- 70% of Companies using HR analytics have a better understanding of their talent needs
- 67% of companies can identify high-potential candidates
- North America is currently the largest workforce analytics market, covering a 35% share of the global market
Key HR Metrics Tracked Through HR Analytics
You'll find the key metrics below that can be tracked through HR analytics.
1. Time to Hire:
Definition: Average days to fill a role
Calculation: From job post to offer acceptance
Business impact: Faster hiring prevents productivity loss.
Data source: ATS, HRIS
2. Turnover Rate:
Definition: Percentage of employees who leave
Calculation: Employees who left ÷ Avg. total employees) × 100
Business impact: Faster hiring prevents productivity loss.
Data source: ATS, HRIS
3. Employee Engagement Score:
Definition: Composite survey score
Calculation: Derived from surveys.
Business impact: Higher engagement drives stronger productivity
Data source: Engagement surveys
4. eNPS:
Definition: Employee Net Promoter Score
Calculation: %Promoters – %Detractors
Business impact: Indicator of employee advocacy and culture health.
Data source: Pulse surveys
5. Absenteeism Rate:
Definition: Ratio of days of absence
Calculation: (Lost days ÷ Available workdays) × 100
Business impact: It monitors culture. Excess absenteeism signals burnout.
Data source: Payroll, time tracking
6. Cost per Hire:
Definition: Total hiring cost/hires
Calculation: Total hiring costs ÷ Number of hires
Business impact: Informs budgeting
Data source: Finance, recruitment data
7. Training Effectiveness:
Definition: Post-training performance
Calculation: Total hiring costs ÷ Number of hires
Business impact: Skills enhancement and growth, and proves L&D investments.
Data source: LMS, appraisal systems
8. Retention Rate:
Definition: % of employees who stay at the organization over a period
Calculation: Employees remaining ÷ Total employees × 100
Business impact: Reflects cultural stability and the effectiveness of employee experience efforts
Data source: HRIS, payroll data, workforce reports.
9. Diversity Ratio:
Definition: proportion of employees from a specific group compared to the total workforce
Calculation: % representation by group
Business impact: Drives DEI progress.
Data source: HRIS, demographic data
10. Promotion Rate:
Definition: % of employees promoted within an organization over a specific time period
Calculation: Total number of promotions / Total number of employees × 100
Business impact: Indicates internal mobility, career growth opportunities, and effectiveness of talent development
Data source: HRIS, performance management systems, workforce records
The HR Analytics Process: From Data to Decisions
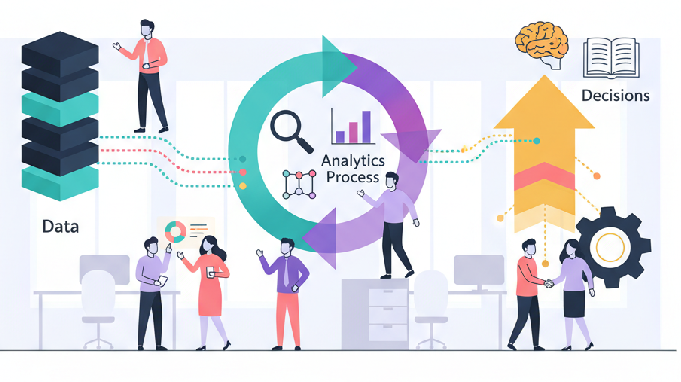
Implementing HR analytics may give you the impression that it's technical and complicated. However, it's a structured way that enables you to transform data into insights and drive business decisions.
Here's a seven-step approach to the HR Analytics process:
1. Define the Business Problem
-
The first step involves defining the business problem. It is essential to explain the problem in business terms rather than just HR terms.
-
For instance, instead of asking, "Why are employees leaving?", come up with a sharper question like, Why is sales attrition 15% higher than the company average, and how can we reduce it by half in the next two quarters?"
-
Pondering over such questions helps connect the data to tangible business goals. And once you define the problem, it becomes easier to identify the kind of data you actually need.
2. Identify the Right Data Sources
-
After determining the problem, the next step involves identifying the appropriate data sources. This entails searching across multiple HR systems, such as HRIS for employee records, ATS for hiring data, LMS for training information, payroll systems for compensation trends, and engagement tools for survey responses.
-
Each system provides a piece of the puzzle. This helps map out a "data journey" that illustrates how each source contributes to the overall story.
-
For example, to study attrition, you can combine exit interview data with performance ratings, tenure information, and engagement survey scores. It narrows down to connecting the dots across systems to get a 360° view of the workforce.
3. Clean and Prepare the Data
-
After identifying the data source, the next step involves data cleaning. This may not be an exciting task, but it is essential. Before diving into analysis, data must be standardized, duplicates removed, and formatted consistently.
-
You need to check for missing fields, correct errors, and ensure that all datasets speak the same "language." For instance, job titles might differ across departments — "Sales Executive" vs. "Sales Rep" — but for analytics, they need to be grouped under a single category.
-
Clean data builds trust. Without it, even the most sophisticated models are likely to produce misleading insights.
4. Analyze the Trends
-
Once your data is ready, the real discovery then begins. You can start with descriptive analysis by understanding what the data indicates at a surface level.
-
Then, look for patterns: Is turnover higher in specific departments? Are engagement scores lower for employees with specific tenure ranges? Correlations can reveal surprising insights.
-
The goal is to move from observation to understanding, that is, uncovering what's driving behavior and not just limiting it to "what's happening".
5. Interpret the Insights
-
Data without context is mere numbers. Interpretation is what churns out the storytelling element in HR analytics. This is what the next step entails. After gathering insights, you need to contemplate what these findings mean for the business.
-
For example, you happen to discover that high turnover is concentrated among first-year employees, which might point to onboarding issues rather than pay dissatisfaction.
-
Now translate these statistical findings into clear business language that any leader understands: "Employees who didn't receive manager check-ins during their first month are twice as likely to leave within 90 days."
-
This step is essential for gaining executive buy-in because leaders are not just after numbers; they seek meaningful and actionable takeaways.
6. Take Action
-
If you think you are done by interpreting insights, then it's a big No. Interpreting insights alone does not fetch outcomes, but action does.
-
After gaining a clear understanding, it is essential to collaborate with business leaders to design necessary interventions that drive outcomes. This could encompass aspects such as revamping onboarding programs, launching manager training, or offering tailored recognition to boost engagement.
-
For instance, if analytics show that employees who leave cite a lack of career growth, a short-term action might be mentorship programs, while a long-term one could be redesigning internal mobility paths.
-
The key is to turn insights into pilots that can be tested and scaled.
7. Evaluate and Iterate
-
The process reaches its fruition in this step through measurement and refinement. Every action you undertake needs to be evaluated to see if it has worked or not.
-
You can compare key metrics before and after interventions, such as changes in turnover, engagement scores, or absenteeism.
-
Evaluation is one such step that guarantees accountability and continuous improvement. As a result, you can always opt for experimentation and analyze its impact. The more evaluations you complete, the smarter your decisions become.
Mistakes to Avoid
While HR analytics can be transformative, there are some mistakes that you need to avoid.
-
Don't start with a tool before you've defined the problem. Technology amplifies strategy and does not replace it.
-
Avoid measuring too many metrics at once. Only focus on those that genuinely influence outcomes.
-
Make sure to communicate findings in business terms and avoid using HR jargon. When analytics tells a clear, human-centered story, it inspires real change.
Tools & Platforms for HR Analytics
Choosing the right HR analytics tool is vital for any organization. It's not about finding the most popular platform but choosing a tool that perfectly aligns with your company's size, goals, and data maturity.
Below, you'll find some tools and platforms most commonly used for analytics, and the types of organizations they are best suited for.
1. Tableau / Power BI
-
Tableau and Power BI are renowned business intelligence platforms that enable highly customizable and flexible dashboards. These tools are beneficial for organizations that possess a large amount of historical data and need to analyze it through advanced visualizations and reporting.
-
They also offer deep integration with various data sources, including HRIS, ATS, payroll systems, etc.
-
Their key strength lies in their ability to build complex visualizations that enable organizations to explore trends and drill down into the data.
Considerations:
-
These tools are best for companies with a dedicated data team that takes the lead in maintaining and managing dashboards and reports.
-
While they offer powerful capabilities, they can be complex to set up and require proper training for HR teams to maximize their benefits.
-
Both platforms can be expensive, especially for smaller organizations. Pricing often depends on the number of users and the complexity of your needs.
2. Visier
-
Visier is one such platform designed explicitly for HR teams. It helps organizations harness the potential of their people data and convert it into actionable insights.
-
Visier entirely focuses on HR data and is built to solve common people-related challenges such as turnover, talent acquisition, and workforce planning.
-
Visier's capabilities include predictive analytics, advanced forecasting, and easy-to-read visualizations that make HR data accessible for non-technical stakeholders. It offers pre-built templates for common HR metrics, simplifying the task of HR leaders to get started without needing to configure everything from scratch.
Considerations:
-
Visier is best suited for large organizations due to its cost and the scale of its features.
-
While Visier is user-friendly, it still requires some involvement of HR leadership to customize and implement it properly.
According to research, large organizations also projected significant growth in roles such as HR administration/help desk (20%), HR functional system support (21%), and learning & development (19%).
3. Workday / SAP SuccessFactors
-
Both Workday and SAP SuccessFactors offer dashboards and reporting tools specifically designed to help HR teams analyze workforce trends, track performance metrics, and measure employee engagement, all in one place.
-
These platforms help HR leaders track key metrics like time-to-hire, employee turnover, and engagement scores, all within their HR management systems.
Considerations:
-
These are best for organizations already using HRIS platforms or looking for a more integrated approach to HR and people analytics.
-
They may lack the depth and customizability of dedicated analytics platforms.
-
These platforms are generally priced as part of a broader HRIS subscription. Hence, the cost will depend on your existing agreement.
4. Google Data Studio
-
Google Data Studio is a free and easy-to-use platform that enables HR teams to create customized dashboards and reports.
-
Although not as powerful or feature-rich as Tableau or Visier, Google Data Studio is an excellent tool for organizations that need a simple, flexible, and cost-effective way to visualize HR data.
-
It integrates with Google Sheets and other data sources, allowing HR teams to easily build reports and dashboards that can be shared across the organization.
-
For small to mid-sized organizations, Google Data Studio can provide a solid foundation for tracking basic HR metrics like employee engagement, time-to-hire, and absenteeism rates.
-
HR teams can also link data from tools like Google Analytics, social media platforms, and internal HR systems for a more comprehensive view of employee engagement and performance.
Considerations:
-
It is best for teams with basic analytics needs or those with limited data complexity.
-
It can be a great starting point for smaller teams, but it may not scale well as the organization grows and requires more advanced analytics capabilities.
-
Free, with some premium integrations available for more advanced features.
Research shows that medium-sized organizations showed a stronger inclination to enhance their HR data analytics capabilities, with 28% planning to increase headcount in this area.
What HR Leaders Should Consider Before Investing in a Tool
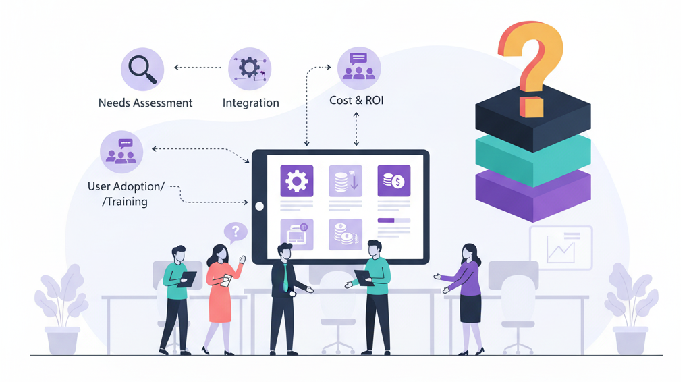
Before making a purchase, HR leaders should take a step back and ask themselves these critical questions:
-
Do we have reliable data? If your HR data is scattered across multiple systems or poorly organized, no tool can be effective. A solid foundation of clean and integrated data is essential for success.
-
What questions do we want to answer? Do you wish to reduce turnover, improve hiring, or measure the ROI of training? Be clear on what kind of problems you're trying to solve. Analytics tools will only be effective when they're aimed at specific business outcomes.
-
What's our data maturity? Do you have the internal resources to maintain complex dashboards and reports? If not, a tool with more pre-configured templates (like Visier or Workday) might work for you.
-
What is our budget? Larger platforms like Visier and Workday come with a hefty price tag. Therefore, it's essential to understand whether the tool will deliver sufficient ROI to justify the cost.
Quick Tip: It's always better to start with a simpler tool and scale up with your evolving analytics needs. Don't try to tackle everything at once.
By carefully evaluating your needs and existing infrastructure, you can choose an HR analytics tool that aligns with your business goals and data capabilities. Whether you're a small team just getting started with analytics or a large enterprise ready to leverage advanced insights, there's a solution out there for you.
HR Analytics in Action: Mini Case Studies
Let's dive into mini case studies to comprehend the powerful impact of HR analytics in action:
- In 2020, a European shipping company experienced high absenteeism among its port-based security officers despite the provision of competitive pay and revised contracts.
By employing simple HR analytics methods, such as job analysis, focus groups, and Excel-based tracking, the HR team determined that unclear job design, rather than compensation, was the primary issue.
By redefining roles to improve clarity, teamwork, and purpose, the company reduced absenteeism by 6%, cut contractor costs by €350,000, and saw notable improvements in morale and team cohesion.
- Evergas, a global transporter of natural gas and petrochemical gases, utilized HR analytics to enhance employee experience and retention across its international workforce.
By partnering with Livingroom Analytics, the company implemented frequent, in-depth surveys and real-time dashboards that enabled tracking key sentiment drivers like belonging, energy, and team dynamics.
Backed by leadership support, Evergas achieved greater transparency across regions, quicker responses to engagement issues, stronger team morale, and measurable improvements in retention and feedback quality.
Final Thoughts
By now, you must have strengthened your understanding of HR analytics in a detailed manner.
At its core, the significance of HR analytics surpasses that of dashboards or data science. It's about people. It's about giving leaders the confidence to make better decisions that improve both performance and the employee experience.
It rests with you to decide how you can leverage analytics to weave its magic and achieve the best results for your organization.
FAQs
What is HR Analytics?
HR analytics is the use of data and statistical methods to improve HR processes and make data-driven decisions.
What are the 4 types of HR Analytics?
The four types are descriptive, diagnostic, predictive, and prescriptive analytics.
What is the difference between HRIS and HR Analytics?
HRIS is a system for managing HR data, while HR analytics uses that data to provide insights and inform strategic decisions.

Riha Jaishi is a Content Marketing Specialist at Vantage Circle and host of the HR Vantage Influencers podcast, where she champions recognition-rich, people-first workplace cultures. Through her dual expertise in content creation and podcast hosting, Riha delivers thought-provoking insights that bridge theory with real-world application. Her engaging conversations with global HR leaders and compelling blog content consistently spotlight critical industry perspectives, empowering organizations worldwide to build more impactful, employee-centric environments.
Connect with Riha on LinkedIn and X, or reach out to editor@vantagecircle.com for inquiries.
")