


Employee Retention Metrics: The KPIs Every HR Leader Should Master
A Global Employee Recognition and Wellness Platform
All it takes is one loose stone, and soon you have an avalanche in your hands. Similarly, all it takes is one resignation, then more to follow within the month. The cost? Over $40,000 per employee, factoring in hiring, training, and lost productivity. That’s not unusual: turnover can cost up to 200% of an employee’s annual salary, according to the Work Institute.
Even more worrying? Nearly 38% of employees leave within their first year (Work Institute 2020 Retention Report).
For HR leaders, this isn’t just a numbers game—it’s a strategic priority. Knowing which metrics to track can mean the difference between losing top talent and building a loyal, engaged workforce.
Let’s dive into the key KPIs every HR leader should master to stay ahead of turnover.
What are Employee Retention Metrics

When I saw 4 people from my team leave in just two months, I couldn’t help but wonder, “why is everyone quitting?” It isn't just about the extra workload left behind. It felt like something deeper, something we hadn’t been paying attention to. That’s when I first heard about employee retention metrics—the numbers that indicate how well a company is retaining its employees.
In simple terms, employee retention metrics help organizations understand who’s staying, for how long, and why that matters. They’re a big part of workforce planning and HR analytics, giving teams the insight they need to create better work environments and avoid costly turnover.
At first, I thought retention and turnover meant the same thing. But here’s the difference:
Retention focuses on the employees who stay.
Turnover looks at the employees who leave.
You need both to really understand what’s going on.
***Quick Definitions ***
Retention Rate: The percentage of employees who stay with the company over a certain period.
Turnover Rate: The percentage of employees who leave during a given timeframe.
And the numbers are serious. According to the Work Institute, 38% of employees leave within their first year, and every departure can cost a company up to 200% of that employee’s annual salary.
Once I started looking at these metrics, it all made sense. They don’t just explain why people leave—they show how companies can get better at making people want to stay.
Why Tracking Retention Metrics Matters
When people stay, businesses thrive. It’s as simple as that, but the impact goes much deeper than just filling seats.
Tracking retention metrics helps companies save money, protect performance, and build stronger teams. Losing an employee isn’t just a temporary inconvenience, it can cost up to 200% of their annual salary in hiring, training, and lost productivity. And if multiple people leave at once? It takes a toll on morale, slows down projects, and puts pressure on those who stay.
But there’s more.
High retention signals a healthy culture. It shows future candidates that people want to work there—boosting employer branding and making your company more competitive in the talent market. In today’s world, where people talk openly about their workplaces, reputation travels fast.
When businesses invest in retention, it sets off a positive chain reaction:
The Ripple Effect of Strong Retention
Retention → boosts Morale
→ drives Engagement
→ fuels Productivity
→ increases Profitability
Companies with highly engaged employees see 23% higher profitability, according to Gallup. And that all starts with making people feel valued enough to stay.
Bottom line? Retention metrics aren’t just an HR tool, they’re a business strategy.
12 Key Employee Retention Metrics to Track (With Formulas)

Keeping employees happy, motivated, and committed to your organization is crucial for success. To achieve this, businesses often rely on vital 'employee retention metrics.' These metrics act as the pulse of your workforce, helping you understand how well you retain valuable talent and identify the grey areas for improvement. Let's explore these key employee retention metrics and how they are pivotal in creating a thriving and engaged workforce.
1. Overall Retention Rate
Definition: Measures the percentage of employees who stay with the company over a specific period.
Formula:
How to calculate retention rate:
((Employees at End − Departures) ÷ Employees at Start) × 100
Interpretation: A higher rate indicates workforce stability. This is often tracked quarterly in HR dashboards to monitor trends over time and flag potential issues.
2. Turnover Rate (Overall, Voluntary, Involuntary)
Definition: Turnover rate measures the percentage of employees who leave during a given period.
Formulas:
Overall Turnover Rate: (Total Departures ÷ Avg. Number of Employees) × 100
Voluntary Turnover Rate: (Voluntary Departures ÷ Avg. Number of Employees) × 100
Involuntary Turnover Rate: (Involuntary Departures ÷ Avg. Number of Employees) × 100
3. Average Employee Tenure
Definition: Indicates how long employees typically stay with the company.
Formula:
Total Years of Service of All Employees ÷ Total Number of Employees
Note: Use both mean and median to avoid distortion by outliers..
4. Regrettable Attrition Rate
Definition: Tracks the percentage of high-performing or critical employees who leave voluntarily.
Value: Losing top talent directly impacts performance and morale.
How it’s classified: Based on performance reviews, critical roles, or leadership input.
Case Study Box:
“When we lost two of our top engineers in the same quarter, project timelines slipped by 3 months. It was a wake-up call to track regrettable attrition more closely.” — HR Leader, SaaS Company
5. Retention Rate by Category
Definition: Measures retention across different segments: by department, manager, gender, ethnicity, etc.
Why it matters: Helps identify specific areas or groups with higher attrition. Applying a DEI lens uncovers hidden patterns in employee experience.
Resource: Excel Template for Category-Based Retention Tracking
6. New Hire Retention Rate
Definition: Measures the percentage of new hires who stay for a defined period (typically 3, 6, or 12 months).
Early Warning Sign: A high number of "quick quits" (resignations within 3 months) signals onboarding or expectation of misalignment.
Resource: 8 Easy Steps To Build a New Employee Onboarding Process
7. Employee Satisfaction Rate (eNPS)
Definition: The Employee Net Promoter Score (eNPS) gauges how likely employees are to recommend the company as a place to work.
Formula:
% Promoters − % Detractors
Link to Retention: High eNPS is often linked to strong retention and engagement.
Sample eNPS Survey Questions:
- How likely are you to recommend this company to a friend?
- What do you like most about working here?
- What can we improve?
8. Employee Engagement Score
Definition: Measures employee involvement, enthusiasm, and commitment.
Survey Tools: Gallup Q12, Culture Amp, or custom pulse surveys.
Why it matters: Low engagement scores often precede turnover.
Sample Questions:
- Do you feel your work is valued?
- Do you have the tools to succeed?
Benchmark: Scores under 50% may indicate disengagement.
9. Cost of Employee Turnover
Definition: The total cost associated with losing and replacing an employee.
Components
Direct: Recruitment, onboarding, training
Indirect: Lost productivity, lower morale, knowledge gaps
Resource: Turnover Cost Calculator
10. Absence Rate
Definition: Tracks unplanned absenteeism over a given period.
Formula:
(Total Days Missed ÷ Total Work Days Available) × 100
Insight: High absenteeism can signal burnout, stress, or disengagement.
Mini Case: A team with 12% absenteeism revealed signs of burnout and triggered a workload audit.
11. Talent Turnover Rate
Definition: Measures turnover among high performers specifically.
Why it matters: Losing top talent hurts innovation and productivity more than average turnover.
Tip: Cross-reference with performance ratings.
Resource: Performance Review Best Practices Guide
12. Flight Risk Prediction
Definition: Uses data models to identify employees likely to leave.
How it works: Combines performance data, survey scores, absenteeism, and tenure with AI or predictive analytics.
Tool Example: Workday People Analytics, Visier, or custom dashboards.
How to Analyze Retention Metrics Effectively

At first, I thought just knowing our retention numbers was enough. But over time, I learned it’s how you look at them that really matters.
1. Look Beyond the Overall Number
One big retention number won’t show you the full picture. I always break it down—by team, role, department, even gender or years of service. For example, we once had an 88% retention rate overall, but one team was down at 60%. We wouldn’t have caught that without digging deeper.
2. Watch for Trends
A small drop might not seem like a big deal, but patterns matter. If new hires are leaving more often, it could mean onboarding or cultural issues. I like to track things like quarterly retention and voluntary exits side by side to catch early warning signs.
3. Compare with Industry Benchmarks
I always check how our numbers stack up against others. For instance, the average voluntary turnover in tech is about 13% (BLS, 2023). So, if we’re at 20%, something’s clearly off.
4. Don’t Just Trust Averages
Averages can be misleading. I once looked at our average tenure and thought all was fine—until I realized a few long-timers were skewing the numbers. Now, I check the median and group people by how long they’ve stayed (like 0–1 year, 1–3 years, etc.) for a clearer picture.
5. Keep Your Data Clean
Messy data = bad insights. I’ve learned to always double-check things—like making sure exit dates are filled in. One missing field can throw everything off. Clean data helps you trust what you’re seeing.
In the end, retention metrics aren’t just numbers. They’re signals. And when you look at them the right way, you can understand what’s really going on—and do something about it.
Industry Benchmarks and What ‘Good’ Looks Like
When I first started tracking retention metrics, I kept wondering, “Is this number good?” That’s when I realized how important it is to compare your data to industry standards. Without that context, you're just guessing.
Here’s what I’ve learned from reports like BLS 2024 and Mercer’s 2025 Talent Trends:
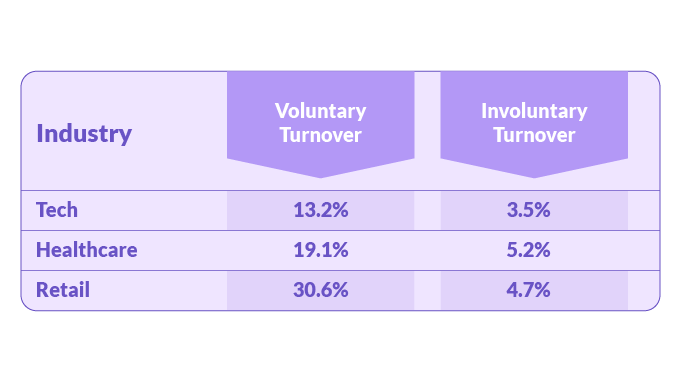
Voluntary Turnover Rates by Industry
| Industry | Voluntary Turnover Estimates |
|---|---|
| Technology | ~8–10% |
| Healthcare (Hospitals) | ~15–18% |
| Retail / Wholesale | ~25–30% |
| Manufacturing | ~2–3% |
| Finance & Insurance | ~1.5–2% |